plot
Plot nonlinearity AM/AM and AM/PM characteristics
Description
plot( plots the output signal power and
the phase change versus the input signal power. This syntax is equivalent to
mnl)plot(mnl,'Pout').
plot( plots the gain and the phase
change versus the input signal power.mnl,'Gain')
mnlplot = plot(___)
Examples
Plot the amplifier output power and phase response for various model methods.
Create a memoryless nonlinearity impairment System object™ for each of the nonlinearity modeling methods.
ampCubicPoly= comm.MemorylessNonlinearity('Method','Cubic polynomial');
ampSaleh = comm.MemorylessNonlinearity('Method','Saleh model');
ampModRapp = comm.MemorylessNonlinearity('Method','Modified Rapp model');
ampLookupTable = comm.MemorylessNonlinearity('Method','Lookup table','ReferenceImpedance',50);
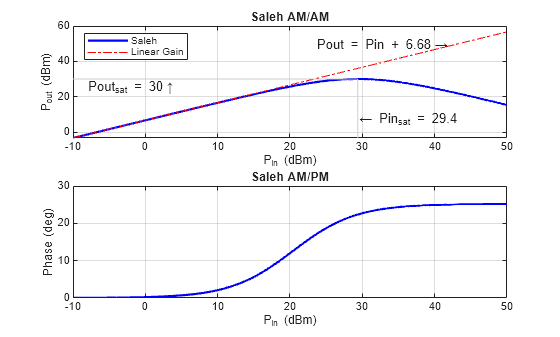
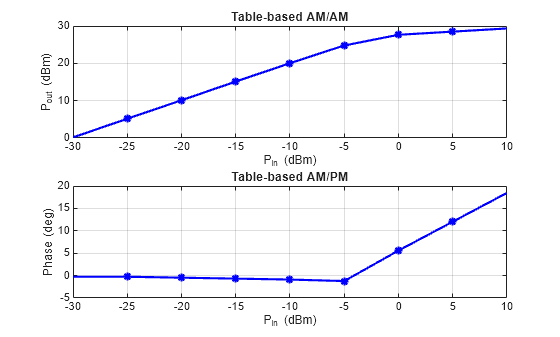
Use the plot object function of the comm.MemorylessNonlinearity System object to show the response curves for the output power and phase for the each of the amplifier models.
plot(ampCubicPoly);

plot(ampSaleh);
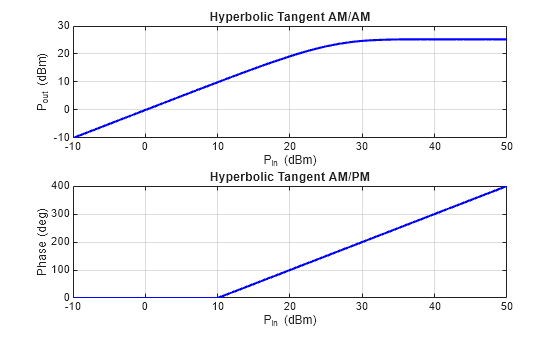
plot(ampLookupTable);
plot(ampModRapp);
Input Arguments
Output Arguments
Version History
Introduced in R2021a