genqammod
General quadrature amplitude modulation (QAM)
Description
Examples
Transmit and receive data using a nonrectangular 16-ary constellation in the presence of Gaussian noise. Show the scatter plot of the noisy constellation and estimate the symbol error rate (SER) for two different SNRs.
Create a 16-QAM constellation based on the V.29 standard for telephone-line modems.
c = [-5 -5i 5 5i -3 -3-3i -3i 3-3i 3 3+3i 3i -3+3i -1 -1i 1 1i];
sigpower = pow2db(mean(abs(c).^2));
M = length(c);
Generate random symbols.
data = randi([0 M-1],2000,1);
Modulate the data by using the genqammod function. General QAM modulation is necessary because the custom constellation is not rectangular.
modData = genqammod(data,c);
Pass the signal through an AWGN channel with a 20 dB SNR.
rxSig = awgn(modData,20,sigpower);
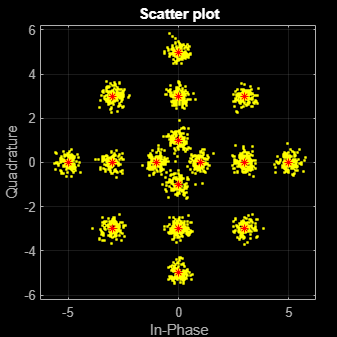
Display a scatter plot of the received signal and the reference constellation c.
h = scatterplot(rxSig);
hold on
scatterplot(c,[],[],'r*',h)
grid
hold off
Demodulate the received signal by using the genqamdemod function. Determine the number of symbol errors and the SER.
demodData = genqamdemod(rxSig,c);
[numErrors,ser] = symerr(data,demodData)
numErrors =
4
ser =
0.0020
Repeat the transmission and demodulation process with an AWGN channel with a 10 dB SNR. Determine the SER for the reduced SNR. As expected, the performance degrades when the SNR is decreased.
rxSig = awgn(modData,10,sigpower);
demodData = genqamdemod(rxSig,c);
[numErrors,ser] = symerr(data,demodData)
numErrors =
457
ser =
0.2285
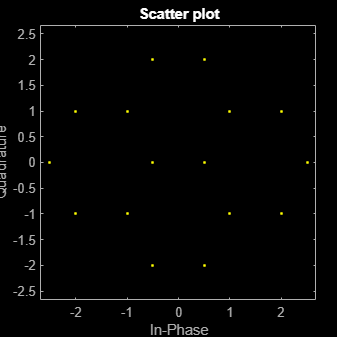
Create the points that describe a hexagonal constellation.
inphase = [1/2 1 1 1/2 1/2 2 2 5/2];
quadr = [0 1 -1 2 -2 1 -1 0];
inphase = [inphase;-inphase]; inphase = inphase(:);
quadr = [quadr;quadr]; quadr = quadr(:);
const = inphase + 1i*quadr;
Plot the constellation.
h = scatterplot(const);
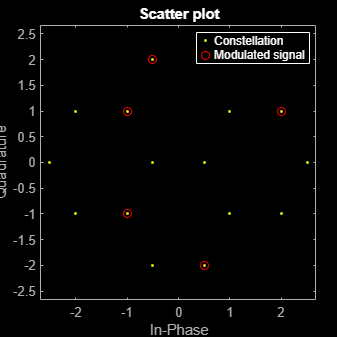
Generate input data symbols. Modulate the symbols using this constellation.
x = [3 8 5 10 7];
y = genqammod(x,const);
Demodulate the modulated signal, y.
z = genqamdemod(y,const);
Plot the modulated signal in same figure.
hold on;
scatterplot(y,1,0,'ro',h);
legend('Constellation','Modulated signal');
hold off;
Determine the number of symbol errors between the demodulated data to the original sequence.
numErrs = symerr(x,z)
numErrs =
0