Transforms and Spectral Analysis
The frequency-domain representation of a signal reveals important signal
characteristics that are difficult to analyze in the time domain. Spectral
analysis lets you characterize the frequency content of a signal. The FFT
and IFFT System objects and blocks in DSP System Toolbox™ enable you to convert a streaming time-domain signal into the
frequency-domain, and vice versa. To compute the spectral estimate of the
signal, use the dsp.SpectrumEstimator
System object™ in MATLAB® and the Spectrum Estimator block in
Simulink®. You can visualize the spectral estimate using the Spectrum
Analyzer object and block.
The Spectrum Analyzer in DSP System Toolbox uses the Welch's method of averaging modified periodogram and the filter bank method. Both these methods are FFT-based spectral estimation methods that make no assumptions about the input data and can be used with any kind of signal. For more information on the algorithm the Spectrum Analyzer uses, see Spectral Analysis. To learn how to estimate the power spectral density of a streaming signal in MATLAB, see Estimate the Power Spectrum in MATLAB.
Categories
- Transforms
Fourier transforms, cosine and wavelet transforms, wavelet scattering
- Linear Prediction
Convert linear predictive coefficients (LPC) to cepstral coefficients, LSF, LSP, RC, and vice versa
- Spectral Analysis
Parametric and nonparametric methods
Related Information
Featured Examples

Spectrum Analyzer Measurements
Use the Spectrum Analyzer block for harmonic distortion measurements (such as THD, SNR, SINAD, and SFDR), third-order intermodulation (TOI) distortion measurements, and adjacent channel power ratio (ACPR) measurements. The example also shows you how to view time-varying spectra by using a spectrogram and automatic peak detection. The example includes five amplifier models, with each model representing a typical setup to perform one of the measurements.

Zoom FFT
Showcases zoom FFT, which is a signal processing technique used to analyze a portion of a spectrum at a high resolution. DSP System Toolbox™ offers this functionality in MATLAB® through the dsp.ZoomFFT System object™, and in Simulink® through the Zoom FFT block in the DSP System Toolbox library.

Detect Air Compressor Sounds in Simulink Using Wavelet Scattering
Use the Wavelet Scattering block and a pretrained deep learning network to classify audio signals.
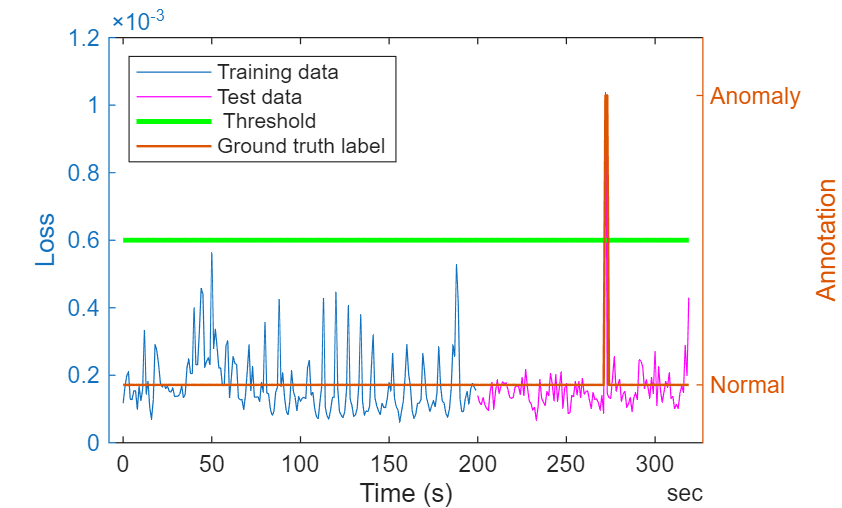
Detect Anomalies in ECG Data Using Wavelet Scattering and LSTM Autoencoder in Simulink
Use wavelet scattering and deep learning network to detect anomalies in ECG signals.
Teaching Resources

Fourier Analysis
Learn the concepts of frequency, magnitude, and phase, and apply them to Fourier series, and continuous and discrete Fourier transforms.