Main Content

surfacePlotterData

Get data for surface plotter

Since R2022b

Description

example

plotterData = surfacePlotterData(manager) returns a structure of plotter data that you can use as an input to the plotSurface function for plotting surfaces managed by the surface manager object manager.

data = surfacePlotterData(___,colorMap) specifies the color map for the plotting data.

Examples

collapse all

Create a tracking scenario.

scene = trackingScenario;

Define the terrain and boundaries of two surfaces and add the two surfaces to the tracking scenario.

terrain1 = randi(100,4,5);
terrain2 = randi(100,3,3);

boundary1 = [0 100;
    0 100-eps];
boundary2 = [0 100;
    100 200];

s1 = groundSurface(scene,Terrain=terrain1,Boundary=boundary1);
s2 = groundSurface(scene,Terrain=terrain2,Boundary=boundary2);

Obtain the plotter data by using the surfacePlotterData function.

plotterData = surfacePlotterData(scene.SurfaceManager)
plotterData=1×2 struct array with fields:
    X
    Y
    Z
    C

Create a theaterPlot object and specify its axial limits.

tp = theaterPlot(ZLimits=[-50 150],YLimits=[-50 250],ZLimits=[-100 100]);

Create a surface plotter.

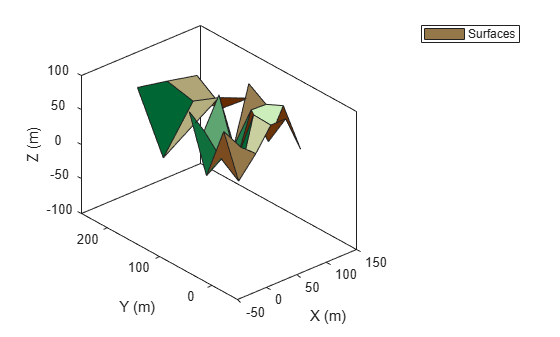
splotter = surfacePlotter(tp,DisplayName="Surfaces");

Plot surfaces in the theater plot. Change the view angles for better visualization.

plotSurface(splotter,plotterData)
view(-41,29)

Input Arguments

collapse all

Surface manager, specified as a SurfaceManager object.

Color map used for plotting surfaces, specified as a three-column matrix of RGB triplets. An RGB triplet is a three-element row vector whose elements specify the intensities of the red, green, and blue components of the color. The intensities can be double or single values in the range [0, 1], or they can be uint8 values in the range [0, 255]. For example, this matrix defines a colormap containing five colors.

map = [0.2 0.1 0.5
       0.1 0.5 0.8
       0.2 0.7 0.6
       0.8 0.7 0.3
       0.9 1   0];

Colordouble or single RGB Tripletuint8 RGB Triplet
Yellow[1 1 0][255 255 0]
Magenta[1 0 1][255 0 255]
Cyan[0 1 1][0 255 255]
Red[1 0 0][255 0 0]
Green[0 1 0][0 255 0]
Blue[0 0 1][0 0 255]
White[1 1 1][255 255 255]
Black[0 0 0][0 0 0]

Output Arguments

collapse all

Plotter data, returned as a P-element array of structures, where P is the number of surfaces saved in the Surfaces property of the SurfaceManager object manager. Each structure has these fields.

Field NameDescription
XDomain of the surface in the x-direction, returned as an M-element real-valued vector. M is the number of x-coordinates for defining the terrain of the surface.
YDomain of the surface in the y-direction, returned as an N-element real-valued vector. N is the number of y-coordinates for defining the terrain of the surface.
ZHeight values of the surface, returned as an N-by-M real-valued matrix. N is the number of elements in the Y field, and M is the number of elements in the X field.
CColor for vertices in the terrain of the surface, returned as an N-by-M-by-3 matrix of RGB triplets. N is the number of elements in the Y field, and M is the number of elements in the X field. The plotSurface function determines the color of a surface patch based on the color of its first vertex.

Version History

Introduced in R2022b