Display Vector Data as Points and Lines
Display vector data on maps as points and lines.
This page shows how to create similar maps using map axes (since R2023a) and axesm-based maps. For a comparison of map axes and axesm-based maps, including when to use each type of display, see Choose a 2-D Map Display.
Prepare Data
Prepare data to use in the examples.
Load a MAT-file containing the coordinates of global coastlines into the workspace. The variables within the MAT-file, coastlat and coastlon, specify numeric latitude and longitude coordinates. Remove the South Pole by clipping the line data.
load coastlines
coast = geolineshape(coastlat,coastlon);
coast = geoclip(coast,[-89 90],[-180 180]);
Specify the locations of three cities (Cairo, Rio de Janeiro, and Perth).
citylat = [30 -23 -32];
citylon = [32 -43 116];
Find the coordinates of two tracks:
A great circle track from Cairo to Rio de Janeiro
A rhumb line track from Cairo to Perth
[gclat,gclon] = track2("gc",citylat(1),citylon(1),citylat(2),citylon(2));
[rhlat,rhlon] = track2("rh",citylat(1),citylon(1),citylat(3),citylon(3));
Create Map Using Map Axes
Display vector data on a map axes object as points and lines.
Set up a map that uses a Mollweide projection. Create the projected coordinate reference system (CRS) using the ESRI code 54009.
figure
proj = projcrs(54009,Authority="ESRI");
mx = newmap(proj);
hold on

Display the global coastlines by using the geoplot function. Specify the line color as gray.
geoplot(coast,Color=[0.4 0.4 0.4])
Display the great circle track from Cairo to Rio de Janeiro using a thick line.
geoplot(gclat,gclon,LineWidth=2)
Display the rhumb line track from Cairo to Perth using a thick, dashed line.
geoplot(rhlat,rhlon,"--",LineWidth=2)Display the locations of the cities by using the geoscatter function.
geoscatter(citylat,citylon,"filled")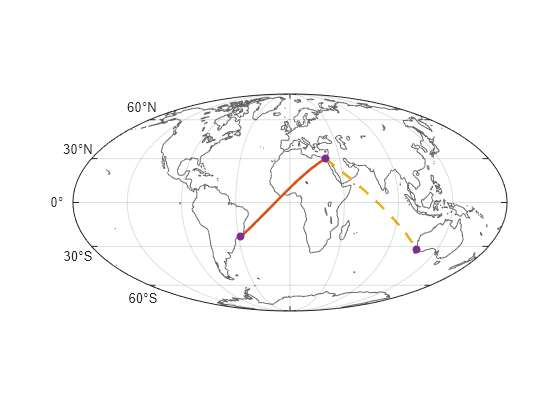
Create Map Using axesm-Based Map
Display vector data on an axesm-based map as points and lines.
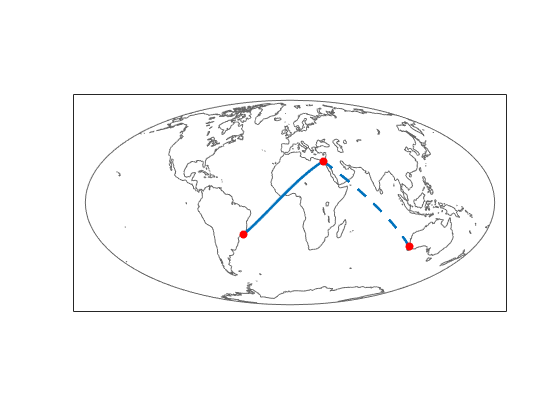
Set up a map that uses a Mollweide projection. Change the color of the frame to gray. Make the line width of the frame thinner.
figure
axesm mollweid
framem("FEdgeColor",[0.4 0.4 0.4],"FLineWidth",0.5)

Display the global coastlines by using the plotm function. Specify the line color as gray.
plotm(coastlat,coastlon,"Color",[0.4 0.4 0.4])Display the great circle track from Cairo to Rio de Janeiro using a thick line.
plotm(gclat,gclon,"LineWidth",2)Display the rhumb line track from Cairo to Perth using a thick, dashed line.
plotm(rhlat,rhlon,"--","LineWidth",2)
Display the locations of the cities by using the scatterm function.
scatterm(citylat,citylon,"r","filled")
Alternatively, you can plot geographic data over axesm-based maps by using the geoshow function.
Tips
To plot data that is already in projected coordinates, use a regular axes object and the mapshow function.