donutchart
Syntax
Description
Vector Data
donutchart( creates a donut chart of
the values in the vector data)data. Each slice has a label indicating its
size as a percentage of the whole donut.
donutchart( creates a donut
chart of categorical values. The number of instances of a category determines the size of
the corresponding slice, and each slice label includes the category name.categoricaldata)
Table Data
donutchart(
specifies the categorical variable tbl,categoricalvar)categoricalvar. The number of
instances of a category determines the size of the corresponding slice, and each slice
label contains the corresponding category name.
Additional Options
donutchart( creates
the donut chart in the specified parent container. The parent container is typically a
figure, panel, or tab. Specify parent,___)parent as the first argument in any of
the previous syntaxes.
donutchart(___,
specifies properties of the chart using one or more name-value arguments. Specify the
name-value arguments after all other input arguments. For example, Name=Value)donutchart([1
2 3],ExplodedWedges=2) creates a donut chart with the second slice
offset.
For a list of properties, see DonutChart Properties.
d = donutchart(___)DonutChart object. Use d to set properties of the chart after creating it. For a list of properties,
see DonutChart Properties.
Examples
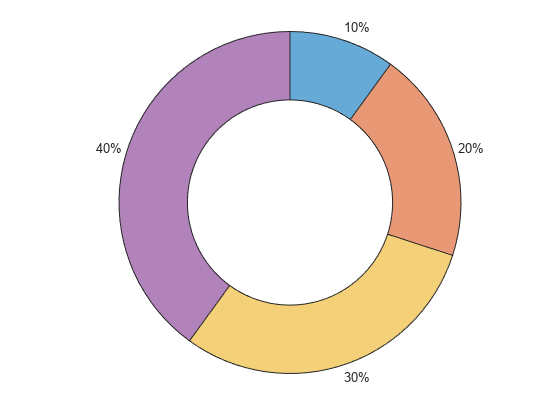
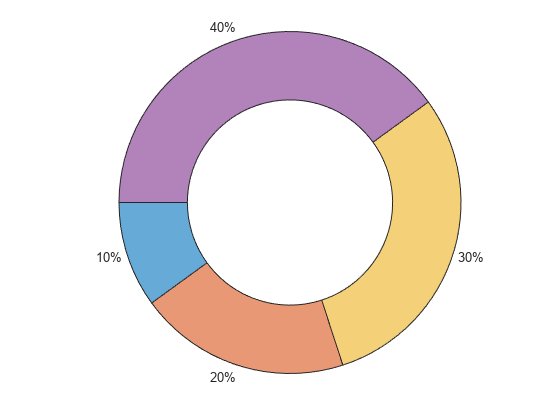
Create a donut chart from a vector of numbers. By default, each slice label displays a percentage value.
data = [1 2 3 4];
donutchart(data)
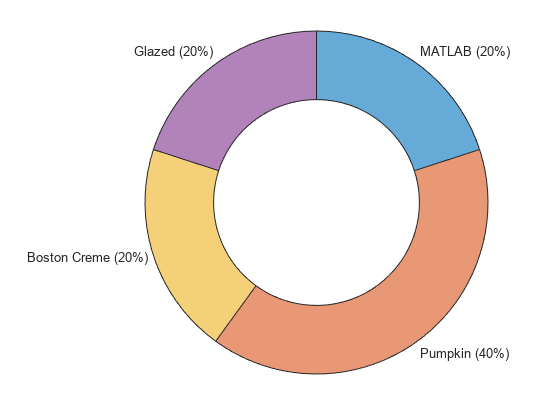
Define a categorical vector flavors. Specify the order in which the categories display in the chart by calling the reordercats function. The donutchart function counts the number of instances of each category to determine the size of each slice.
Create a donut chart from the categorical vector and specify the center label as Donuts. Specify an output argument to store the DonutChart object.
flavors = categorical(["Glazed","Pumpkin","Pumpkin","MATLAB","Boston Creme"]);
flavors = reordercats(flavors,["MATLAB","Pumpkin","Boston Creme","Glazed"]);
d = donutchart(flavors,CenterLabel="Donuts");
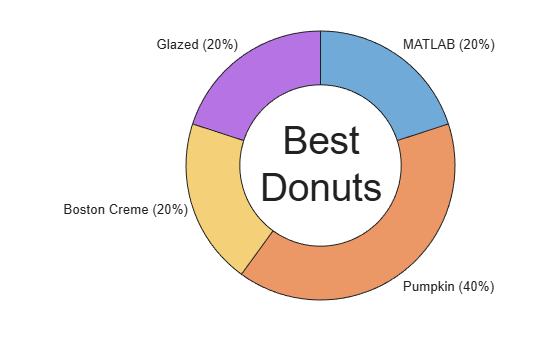
Change the center label by setting the CenterLabel property of the DonutChart object.
d.CenterLabel = ["Best","Donuts"];
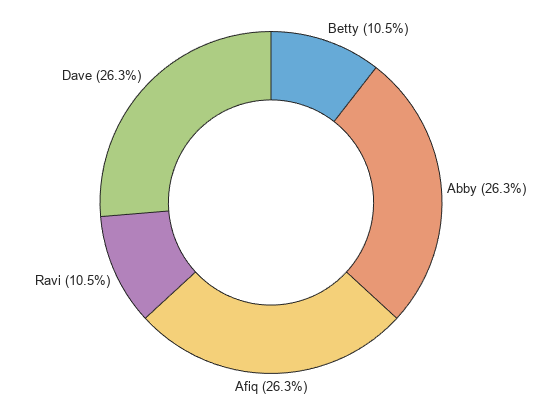
Create a table containing the names of bakers in a donut contest and the corresponding number of votes.
Bakers = ["Betty";"Abby";"Afiq";"Ravi";"Dave"];
Votes = [2; 5; 5; 2; 5];
tbl = table(Bakers,Votes)
tbl=5×2 table
    Bakers     Votes
    _______    _____

    "Betty"      2
    "Abby"       5
    "Afiq"       5
    "Ravi"       2
    "Dave"       5
Create a donut chart from the table.
donutchart(tbl,"Votes","Bakers")
You can specify the rotation direction and shift all the slices around the circle by setting properties. You can set properties by specifying name-value arguments when you call the donutchart function, or you can set properties of the DonutChart object later.
Create a vector called data and use it to create a donut chart. By default, the slices appear in a clockwise direction and the left edge of the first (blue) slice is at 0 degrees (12 o'clock).
data = [1 2 3 4];
donutchart(data)

Create another donut chart, but this time, set the Direction property to "counterclockwise" by specifying it as a name-value argument. Call the donutchart function with an output argument to store the DonutChart object.
p = donutchart(data,Direction="counterclockwise");
Shift the slices by 90 degrees counterclockwise by setting the StartAngle property of the DonutChart object to -90.
p.StartAngle = -90;
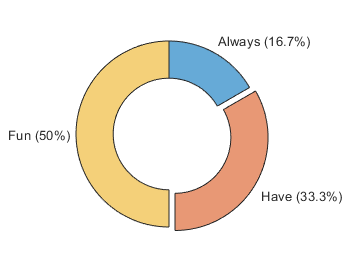
You can change the slice labels from percentages to counts by setting the LabelStyle property. The LabelStyle property has options for displaying different combinations of slice names, data values, and percentages.
Create a donut chart from a numeric vector and a vector of names. Specify an output argument to store the DonutChart object. Then change the labels to include the data values instead of the percentages.
data = [1 2 3];
names = ["Jelly","Glazed","Frosted"];
d = donutchart(data,names);
d.LabelStyle = "namedata";
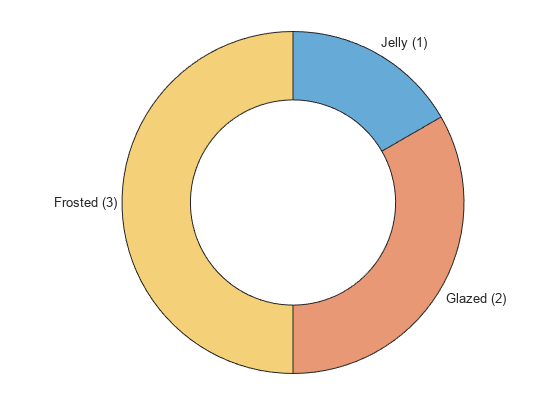
Another option is to display just the names without any data or percentage values.
d.LabelStyle="name";
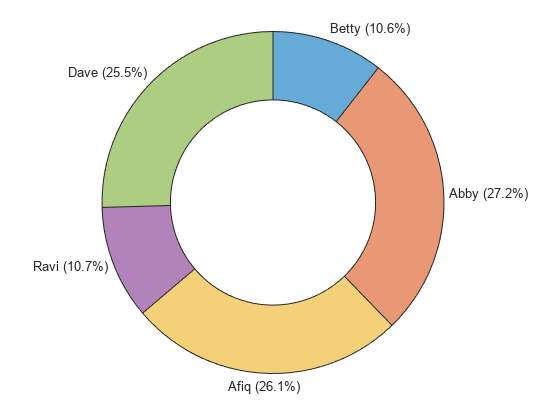
Create a donut chart that shows the percentage of total sales for each participant in a bake sale. Call the donutchart function with an output argument to store the DonutChart object so you can change aspects of the chart later.
Bakers = ["Betty","Abby","Afiq","Ravi","Dave"];
Sales = [20 51.55 49.37 20.35 48.25];
d = donutchart(Sales,Bakers,CenterLabel="Bakers");
Query the slice names of the DonutChart object.
d.Names
ans = 1×5 string
    "Betty"    "Abby"    "Afiq"    "Ravi"    "Dave"
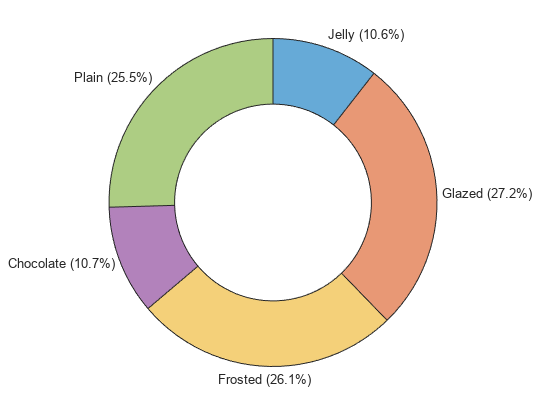
Change the slice names to the donut flavors, and change the center label to Favorite Donuts.
d.Names = ["Jelly","Glazed","Frosted","Chocolate","Plain"];
d.CenterLabel = ["Favorite","Donuts"];
Display each label as two lines of text, with the donut flavor on the first line and the sales number on the second line. To combine the different elements for each label, start with the Names property, and add a newline character, a dollar sign, and the Sales vector (converted to a string).
d.Labels = d.Names + "\newline$" + string(Sales);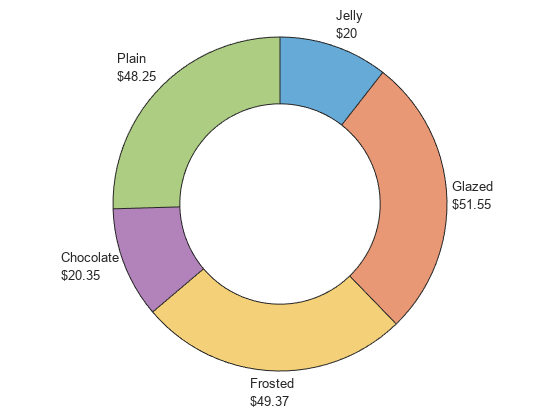
Since R2024b
You can change the colors of your donut chart by using the colororder function. For example, create a donut chart with the default colors.
donutchart([1 2 3 4])

You can choose from several named color palettes, including gem (default), glow, sail, reef, meadow, dye, and earth. Change the color palette to meadow.
colororder meadow
Change the color palette to sail.
colororder sail
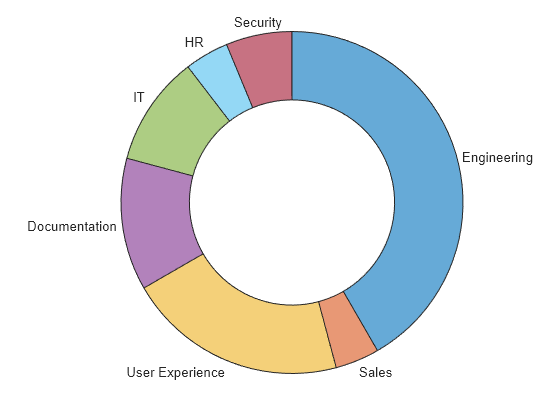
You can consolidate the data from multiple small slices into one slice named "Others" by setting the NumDisplayWedges property. You can also arrange the slices in ascending or descending order by setting the DisplayOrder property.
For example, create a donut chart that shows the number of employees at a company by department. When you create the chart, specify an output argument to store the DonutChart object so you can modify it later.
employees = [100 10 50 30 25 10 15];
departments = ["Engineering" "Sales" "User Experience" "Documentation" "IT" "HR" "Security"];
d = donutchart(employees,departments,LabelStyle="name");
Arrange the slices in descending order according to the number of employees.
d.DisplayOrder = "descend";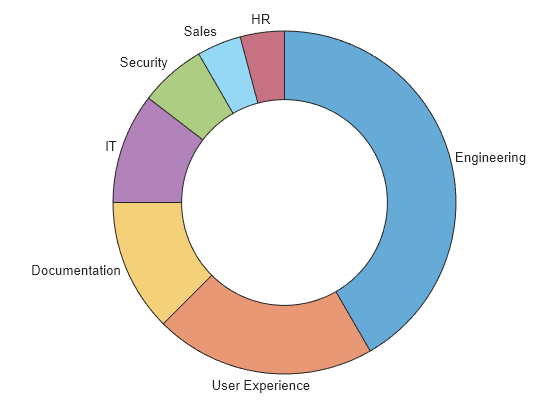
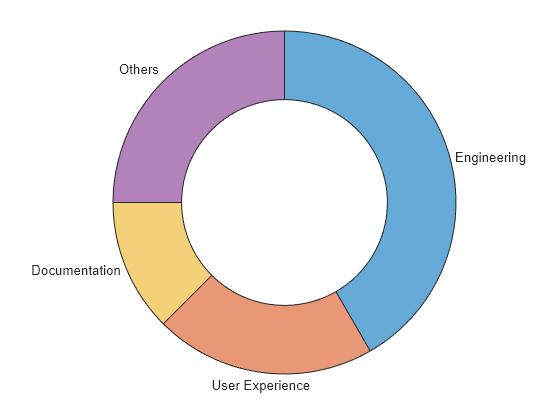
Display three slices and consolidate the other slices into a fourth slice named "Others". Because the slices were sorted in descending order by the DisplayOrder property, setting NumDisplayWedges to 3 displays the three largest slices.
d.NumDisplayWedges = 3;
To create multiple charts in a figure, use a tiled chart layout.
Create a 1-by-2 tiled chart layout. Create the first chart by calling the nexttile function followed by the donutchart function. Repeat these steps for the second chart.
tiledlayout(1,2)
nexttile
donutchart([1 2 3 4],CenterLabel="2022")
nexttile
donutchart([10 3 1 5 6 4],CenterLabel="2023")

Input Arguments
Name-Value Arguments
Specify optional pairs of arguments as
Name1=Value1,...,NameN=ValueN, where Name is
the argument name and Value is the corresponding value.
Name-value arguments must appear after other arguments, but the order of the
pairs does not matter.
Example: donutchart([1 2 3 4],StartAngle=90) creates a donut chart
with a starting angle of 90 degrees.
Note
The properties listed here are only a subset. For a full list, see DonutChart Properties.
Offset slices, specified as a numeric or logical vector for numeric data. If you create the chart using categorical data, you can specify a string vector or a character vector containing one or more category names. The orange slice in this donut chart is offset.
Example: donutchart([5 7 4 6],ExplodedWedges=3) creates a donut
chart with the third slice offset.
Example: donutchart([5 7 4 6],ExplodedWedges=[1 3]) creates a donut
chart with the first and third slices offset.
Example: donutchart([5 7 4 6],ExplodedWedges=[false false true
false]) creates a donut chart with the third slice offset.
Example: donutchart(categorical(["A" "B" "C"
"D"]),ExplodedWedges="B") creates a donut chart using categorical data
with slice B offset.
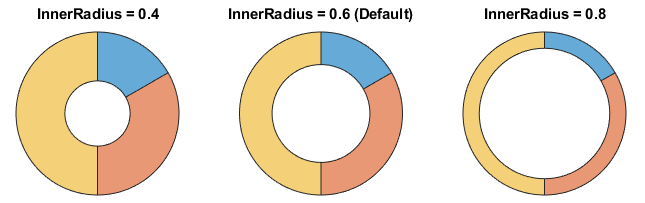
Inner radius, specified as a scalar in the range [0, 1]. A value of 0
creates a pie chart with no hole, and a value of 1 creates a thin
ring with no apparent slices.
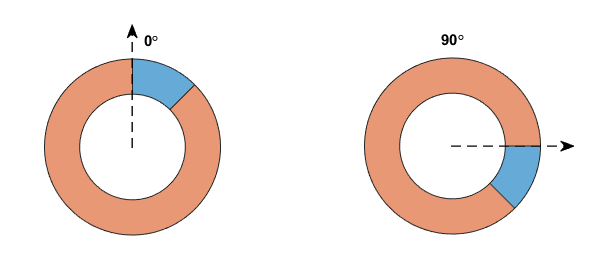
Starting angle of the first slice, specified as a scalar value in degrees. By default, the starting angle is 0 degrees. Positive values rotate the slices in a clockwise direction. Negative values rotate the slices in a counterclockwise direction.
You can envision the location of the starting angle by considering the arrangement of numbers
on a clock. A starting angle of 0 degrees corresponds to 12 o'clock,
and a starting angle of 90 degrees corresponds to 3 o'clock.
Data Types: single | double | int8 | int16 | int32 | int64 | uint8 | uint16 | uint32 | uint64
Direction for adding slices, specified as "clockwise" or "counterclockwise".
"clockwise"— Add slices in a clockwise direction."counterclockwise"— Add slices in a counterclockwise direction.
Output Arguments
More About
Version History
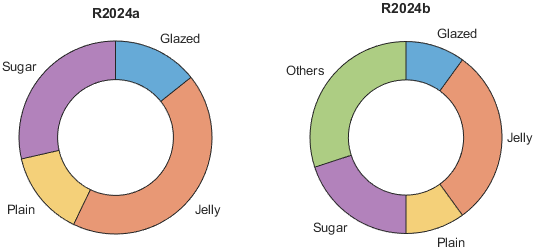
Introduced in R2023bDonut charts include undefined categorical values and show them in a slice labeled
"Others" by default. Previously, undefined values were excluded from
the calculation of the Proportions property, and the values were not
shown as slices in the chart. This change makes it easier to understand the nature of
categorical data in the chart.
For example, create a donut chart using a categorical array containing three undefined
values (""). In R2024a, the chart excludes the undefined values. In
R2024b, the chart contains a slice labeled "Others" to represent the
undefined values.
cats = categorical(["Glazed" "Jelly" "Jelly" "Jelly", ...
     "Sugar","Sugar","Plain","","","",]);
donutchart(cats,LabelStyle="name")
To exclude the "Others" slice from the chart and exclude the
undefined values from the Proportions calculation, set the ShowOthers property to "off".
donutchart(cats,LabelStyle="name",ShowOthers="off")