Monitor Monte Carlo Batch Jobs with ValueStore
This example shows how to monitor a Monte Carlo batch job during execution by using ValueStore.
All jobs have an associated ValueStore object that you can use to access data while the job is running. You can continue to use the command line while the job runs. This example shows how to use the ValueStore object to access and monitor data from a batch Monte Carlo simulation while the job is running.
Estimate π with Monte Carlo
You can estimate the value of π using a variety of Monte Carlo methods. This example shows how to estimate π with the simple Monte Carlo area method.
To estimate π with the Monte Carlo Area method, you perform these steps:
Randomly generate and coordinates of a point from a uniform distribution.
Determine whether the point is inside a circle inscribed in a square. Update the number of points in the circle and total number of points.
Repeat as needed to refine the estimate.
For more details, see the Simple Monte Carlo Area Method section of the example.
Run multiple simulations in parallel and store the interim results in the job ValueStore object as key-value entries. Use the updatePlot helper function to retrieve and process the results from the ValueStore object and update the plots to monitor the progress of the simulation.
Prepare Plots to Visualize Interim Results
Specify the radius of the circle and the number of parfor-loops over which the job iterates.
r = 1;
steps = 200;
Create two plots to visualize the interim results of the Monte Carlo simulation. Include settings such as the title, labels, and limits. Set the aspect ratio of the axes so that they do not change when they update automatically during the simulation.
fig1 = figure(Name="Estimate Pi with Monte Carlo",Visible="on");
ax1 = gca(fig1);
theta = linspace(0,2*pi);
m = cos(theta);
n = sin(theta);
plot(ax1,m,n,"k")
xlabel(ax1,"Value of $x$",Interpreter="latex");
ylabel(ax1,"Value of $y$",Interpreter="latex");
title(ax1,"Randomly Generated Points in Circle",Interpreter="latex");

axis(ax1,"equal",[-1 1 -1 1])

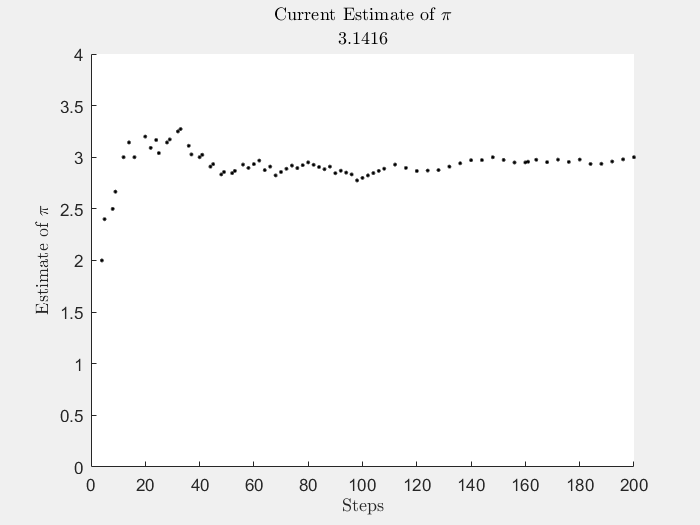
fig2 = figure(Name="Current Pi Estimate",Visible="on");
ax2 = gca(fig2);
xlabel(ax2,"Steps",Interpreter="latex");
ylabel(ax2,"Estimate of $\pi$",Interpreter="latex");
title(ax2,"Current Estimate of $\pi$",Interpreter="latex");
xlim(ax2,([0 steps]))
ylim(ax2,([0 4]))
Set Up and Submit Batch Job
Create a cluster object from your default cluster parallel environment. To check your default parallel environment, on the MATLAB® Home tab, in the Environment section, click Parallel and pause on Select Parallel Environment.
cluster = parcluster;
The GeneratePoints function, defined at the end of the example, contains the Monte Carlo simulation definition. Use batch to offload the computations in GeneratePoints with the input arguments r and steps. Use the Pool name-value argument to create a parallel pool with four workers. Because the batch function uses another worker to run the function, make sure the number of pool workers requested is one less than the number of workers available in the cluster.
job = batch(cluster,@generatePoints,1,{r,steps},Pool=4);Set up the KeyUpdatedFcn callback. Get the ValueStore object of the job and set up a callback function to execute when the job adds an entry to the ValueStore object.
The UpdatePlot callback function runs when the job adds an entry to the ValueStore object in each parfor-loop. This function updates the plots with the new data.
The job can write information to the ValueStore object before the software sets up the KeyUpdatedFcn callback. To prevent this behavior by setting up the KeyUpdatedFcn callback before submitting the job, use the createCommunicatingJob function.
store = job.ValueStore;
store.KeyUpdatedFcn = @(store,key) updatePlot(ax1,ax2,store,key);
Use wait to maintain an active connection to the job in a live script. Using wait blocks the command line while the job is running. Alternatively, call the plain script version of this example from the MATLAB command line to use the command line during execution. The plots can take a long time to update.
disp("Waiting for job to finish ...")Waiting for job to finish ...
wait(job);
disp("Job completed")
Job completed
After the job finishes, you still have access to the job ValueStore object. You can access data from the ValueStore object with keys. For example, view the data for Step 6.
disp("Fetching example result for step 6:")Fetching example result for step 6:
resultFromStep6 = store("Step 6")resultFromStep6 = struct with fields:
step: 6
x: 0.2767
y: 0.0389
in_circle: 1
point_color: 'r'
Retrieve the results of the job and then delete the job.
pointsData = fetchOutputs(job);
delete(job)
clear job
Supporting Functions
Monte Carlo Simulation
The generatePoints function randomly places points in a square. The function uses rand to generate two random numbers, and , from a uniform distribution in the interval (-r, r). The function then determines whether the point defined by values of and is inside the circle and stores the values of and in the job ValueStore object with a unique key. If the point is inside the circle, the function assigns a value of 1 and a red color to the entry. If the point is outside the circle, the function assigns a value of 0 and a blue color to the entry. The ValueStore object gets a new entry in every iteration of the parfor-loop. Save the results in the sliced variable points, which you can access as a property of the job.
function points = generatePoints(r,steps)
points = zeros(steps,4);
parfor idx = 1:steps
    x = (r+r)*rand - r;
    y = (r+r)*rand - r;
    pause(2) % Use pause to control the speed of the example.
    if sqrt(x^2 + y^2) < r
        points(idx,:,end) = [idx x y 1];
        point_color = 'r';
        in_circle = 1
    else
        points(idx,:,end) = [idx x y 0];
        point_color = 'b';
        in_circle = 0
    end

    % Get the ValueStore object of the current job.
    store = getCurrentValueStore;
    % Store the simulation results in the
    % job ValueStore object with a unique key.
    key = "Step " + idx;
    store(key) = struct(step=idx,x=x,y=y, ...
        in_circle=in_circle,point_color=point_color);
end
end
Update Results Live
Use a plot of the intermediate results to monitor the progress of the Monte Carlo π estimation. The updatePlot function updates the plot each time the job updates the ValueStore object.
function updatePlot(ax1,ax2,store,key)
% Update results from the job ValueStore object.
result = store(key);

% Estimate pi with all the data stored in the ValueStore object.
keyset = keys(store); % Return all the keys of the ValueStore object.
all_data = cell2mat(get(store,keyset)); % Convert to a structure array.
hits = [all_data.in_circle]; % Concatenate the result from each key.
pi_estimate = (sum(hits)*4)/(numel(hits));

% Update the plots with the new x and y values and the estimate of pi.
hold([ax1 ax2],'on');
plot(ax1,result.x,result.y,'.',Color=result.point_color);
plot(ax2,numel(hits),pi_estimate,".-k");
title(ax2,"Current Estimate of $\pi$",num2str(pi),Interpreter="latex");
hold([ax1 ax2],'off');
drawnow nocallbacks;
end
Simple Monte Carlo Area Method
Given a circle with radius r inscribed within a square with sides of length 2r, the area of the circle is related to the area of the square by π. This figure illustrates the problem.

You can derive π from the ratio of the area of the circle divided by the area of the square:
To estimate the area of the circle without using π directly, randomly generate a uniform sample of two dimensional (2-D) points inside the square and count how many are inside the circle. The probability that a point can be found in the circle is the ratio of the area of the circle divided by the area of the square.
To determine whether a point is inside the circle, randomly generate two values for the and coordinates of a point and calculate the distance between the point and the origin of the circle. The distance from the origin to the generated point is given by this equation:
If is less than the radius of the circle, the point is inside the circle. Generate a large sample of points and count how many are inside the circle. Use this data to obtain a ratio of points inside the circle to the total number of points generated. This ratio is equivalent to the ratio of the area of the circle to the area of the square. You can then estimate π using:
See Also
batch | ValueStore | createCommunicatingJob