viewArray
View array geometry
Description
viewArray(
plots the geometry of the array, with additional options specified
by one or more array,Name=Value)Name=Value pair
arguments.
hndl = viewArray(___)
Examples
Display the geometry of a uniform linear array having overlapped subarrays.
Create a 16-element ULA that has five 4-element subarrays. Some elements occur in more than one subarray.
h = phased.ULA(16);
ha = phased.PartitionedArray(Array=h,...
    SubarraySelection=...
    [1 1 1 1 0 0 0 0 0 0 0 0 0 0 0 0;...
    0 0 1 1 1 1 0 0 0 0 0 0 0 0 0 0;...
    0 0 0 0 1 1 1 1 0 0 0 0 0 0 0 0;...
    0 0 0 0 0 0 0 0 1 1 1 1 0 0 0 0;...
    0 0 0 0 0 0 0 0 0 0 0 0 1 1 1 1]);
Display the geometry of the array, highlighting all subarrays.
viewArray(ha);
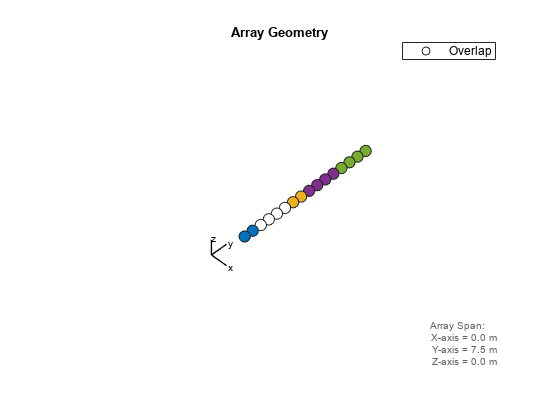
Each color other than white represents a different subarray. White represents elements that occur in multiple subarrays.
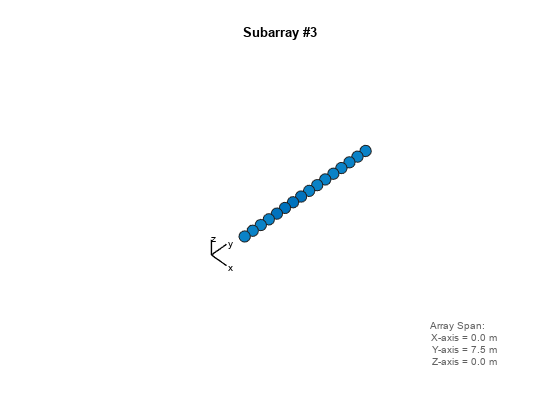
Examine the overlapped subarrays by creating separate figures that highlight the first, second, and third subarrays. In each figure, dark blue represents the highlighted elements.
for idx = 1:3
    figure;
    viewArray(ha,'ShowSubarray',idx,...
        Title=['Subarray #' num2str(idx)]);
end


Input Arguments
Name-Value Arguments
Output Arguments
Version History
Introduced in R2012a