plot
Plot waveform from waveform library
Syntax
Description
plot(
also specifies whether to plot the real and/or imaginary parts of the waveform using
the (pulselib,idx,'PlotType',Type)'PlotType',Type) name-value pair
argument.
plot(___,
also specifies the index, 'PulseIdx',pidx)pidx, of the pulse to plot using the
('PulseIdx',pidx) name-value pair
argument.
hndl = plot(___)hndl, in the figure.
Examples
Construct a waveform library consisting of three waveforms. The library contains one rectangular waveform, one linear FM waveform, and one stepped-FM waveform.
waveform1 = {'Rectangular','PRF',1e4,'PulseWidth',70e-6};
waveform2 = {'LinearFM','PRF',1e4,'PulseWidth',70e-6, ...
    'SweepBandwidth',1e5,'SweepDirection','Up', ...
    'SweepInterval', 'Positive'};
waveform3 = {'SteppedFM','PRF',1e4,'PulseWidth', 70e-6,'NumSteps',5, ...
    'FrequencyStep',50000,'FrequencyOffset',0};
fs = 1e6;
wavlib = pulseWaveformLibrary('SampleRate',fs, ...
    'WaveformSpecification',{waveform1,waveform2,waveform3});
Plot the linear FM waveform using the plot method.
plot(wavlib,2)
Construct a waveform library consisting of three waveforms. The library contains a rectangular, a linear FM, and a phase-coded waveform. Then, obtain and plot the real and imaginary parts of the phase-coded waveform.
waveform1 = {'Rectangular','PRF',1e4,'PulseWidth', 50e-6};
waveform2 = {'LinearFM','PRF',1e4,'PulseWidth',50e-6, ...
    'SweepBandwidth',1e5,'SweepDirection','Up',...
    'SweepInterval', 'Positive'};
waveform3 = {'PhaseCoded','PRF',1e4,'Code','Zadoff-Chu', ...
    'SequenceIndex',3,'ChipWidth',5e-6,'NumChips',8};
fs = 1e6;
wavlib = pulseWaveformLibrary('SampleRate',fs, ...
    'WaveformSpecification',{waveform1,waveform2,waveform3});
Extract the waveform from the library.
wav3 = wavlib(3);
Plot the waveform using the plot method.
plot(wavlib,3,'PlotType','complex')

Construct a waveform library consisting of three waveforms. The library contains one rectangular, one linear FM, and one stepped-FM waveforms. Then, plot the real parts of the first three pulses of the stepped-fm waveform.
waveform1 = {'Rectangular','PRF',1e4,'PulseWidth',70e-6};
waveform2 = {'LinearFM','PRF',1e4,'PulseWidth',70e-6, ...
    'SweepBandwidth',1e5,'SweepDirection','Up', ...
    'SweepInterval', 'Positive'};
waveform3 = {'SteppedFM','PRF',1e4,'PulseWidth', 70e-6,'NumSteps',5, ...
    'FrequencyStep',50000,'FrequencyOffset',0};
fs = 1e6;
wavlib = pulseWaveformLibrary('SampleRate',fs, ...
    'WaveformSpecification',{waveform1,waveform2,waveform3});
Plot the first three pulses of the waveform using the plot method.
plot(wavlib,3,'PulseIdx',1)
plot(wavlib,3,'PulseIdx',2)
plot(wavlib,3,'PulseIdx',3)
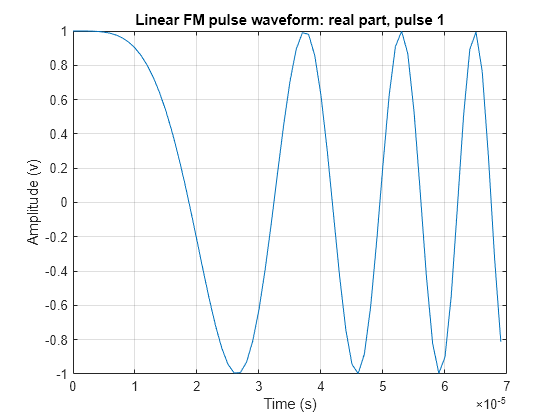
Construct a waveform library consisting of three waveforms. The library contains one rectangular, one linear FM, and one stepped-FM waveforms. Then, plot the linear FM waveform.
waveform1 = {'Rectangular','PRF',1e4,'PulseWidth',70e-6};
waveform2 = {'LinearFM','PRF',1e4,'PulseWidth',70e-6, ...
    'SweepBandwidth',1e5,'SweepDirection','Up',...
    'SweepInterval', 'Positive'};
waveform3 = {'SteppedFM','PRF',1e4,'PulseWidth', 70e-6,'NumSteps',5, ...
    'FrequencyStep',50000,'FrequencyOffset',0};
fs = 1e6;
wavlib = pulseWaveformLibrary('SampleRate',fs, ...
    'WaveformSpecification',{waveform1,waveform2,waveform3});
Plot the waveform using the plot method.
plot(wavlib,2,':')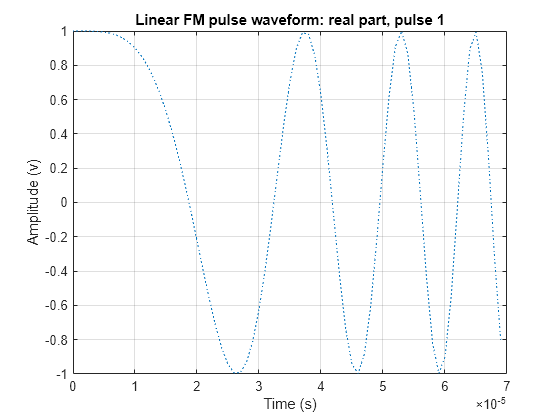
Input Arguments
Name-Value Arguments
Output Arguments
Version History
Introduced in R2021a