radarScenarioRecording
Return recording of radar scenario
Description
Use the radarScenarioRecording object to record a radar scenario.
Creation
You can create a radarScenarioRecording object in these ways:
Create a recording of a
radarScenarioobject by using therecordfunction and specifying the 'RecordingFormat' name-value argument as'Recording'.Create a recording from prerecorded radar scenario data by using the
radarScenarioRecordingfunction described here.
Syntax
Description
recording = radarScenarioRecording(recordedData) creates a
radarScenarioRecording object using recorded data. The
recordedData argument sets the value of the RecordedData
property.
recording = radarScenarioRecording(recordedData,Name,Value) sets
one or both of the CurrentTime and
CurrentStep properties
using name-value arguments. Enclose each property name in quotes.
Properties
Object Functions
Examples
Load prerecorded data from a radar scenario. The data is saved as a struct with the variable name recordedData. Create a radarScenarioRecording object using the recorded data.
load recordedRadarScenarioData.mat
recording = radarScenarioRecording(recordedData);
Construct a theater plot to display the recorded data using multiple plotters.
tp = theaterPlot('AxesUnits',["km" "km" "km"], ...
    'XLimits',[-50 50]*1e3,'YLimits',[-50 50]*1e3,'ZLimits',[-20 20]*1e3);
to = platformPlotter(tp,'DisplayName','Tower','Marker','d');
pp = platformPlotter(tp,'DisplayName','Targets');
dp = detectionPlotter(tp,'DisplayName','Detections','MarkerFaceColor','black');
cp = coveragePlotter(tp,'DisplayName','Radar Beam');

coverage = struct('Index',1,'LookAngle',[0;-7],'FieldOfView',[1;10], ...
    'ScanLimits',[0 365;-12 -2],'Range',100e3,'Position',[0;0;-15], ...
    'Orientation',eye(3));
Run the recorded scenario and animate the results.
scanBuffer = {};
while ~isDone(recording)
    % Step the reader to read the next frame of data
    [simTime,poses,covcon,dets,senconfig] = read(recording);
    scanBuffer = [scanBuffer;dets]; %#ok<AGROW>
    plotPlatform(to,poses(1).Position);
    plotPlatform(pp,reshape([poses(2:4).Position]',3,[])');
    plotCoverage(cp,covcon);
    if ~isempty(dets)
        plotDetection(dp,cell2mat(cellfun(@(c) c.Measurement(:)', scanBuffer, 'UniformOutput', false)));
    end

    % Clear the buffer when a 360 degree scan is complete
    if senconfig.IsScanDone
        scanBuffer = {};
        dp.clearData;
    end
end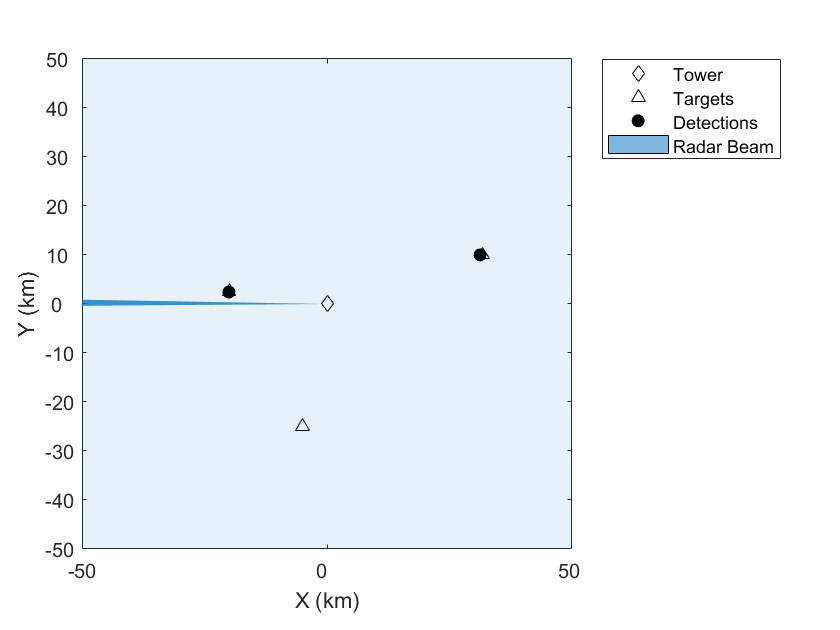
Version History
Introduced in R2021a