Report on MATLAB Functions
The Report API provides multiple ways to report on Simulink®
MATLAB® Function blocks and Stateflow®
MATLAB functions. To report detailed information, use the slreportgen.report.MATLABFunction reporter. This reporter reports properties,
arguments, function code, function symbols, and supporting functions.
Other ways to report on MATLAB Function blocks or Stateflow
MATLAB functions are by using the SimulinkObjectProperties or
StateflowObjectProperties reporter, respectively. These reporters,
however, do not provide function code formatting or report function symbols, supporting
functions, or arguments. Use these reporters if you want only property information.
The Report API provides finders for finding blocks and Stateflow elements, including MATLAB Functions, throughout a model or chart. These finders are the
BlockFinder, DiagramElementFinder, and
StateflowDiagramElementFinder.
These examples show how to use a finder in your report generator program. For cases
where you know the handle or path to a MATLAB Function, you do not need to use a finder (see slreportgen.report.MATLABFunction for examples).
Find and Report MATLAB Function Blocks
Use Report API finders and the slreportgen.report.MATLABFunction reporter to report on MATLAB Function blocks.
Import the Report and Finder namespaces so that you do not have to use fully qualified class names.
import slreportgen.report.*
import slreportgen.finder.*

model_name = "SpiralGalaxyRptGenExample";
load_system(model_name);
rpt = slreportgen.report.Report;
Use the BlockFinder to find all blocks of type SubSystem, which includes MATLAB Function blocks. If you search for all block types, the BlockFinder can take more time to return results than if you limit the search to SubSystem block types.
blkfinder = BlockFinder(model_name);
blkfinder.BlockTypes = "SubSystem";
blks = find(blkfinder);
Loop through the returned SubSystem blocks to test whether the block is a MATLAB Function block. Create a MATLABFunction reporter for each MATLAB Function block, set desired properties, and add each result to a report.
for i=1:length(blks)
   block = blks(i).Object;
   if slreportgen.utils.isMATLABFunction(block)
      rptr = MATLABFunction(block);
      rptr.IncludeArgumentProperties = true;
      add(rpt,rptr);
   end
end
Close the report and model.
close(rpt);
close_system(model_name);
rptview(rpt);
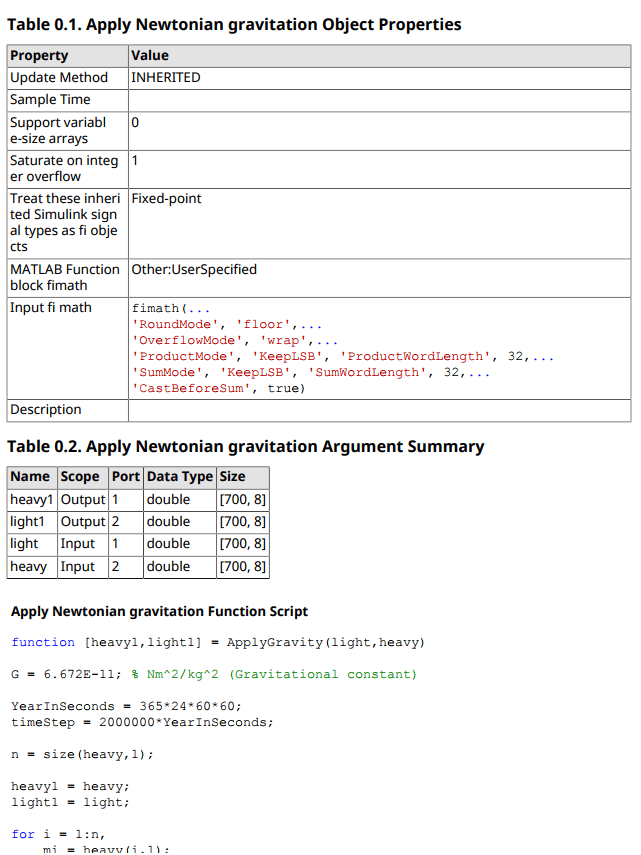
This image shows a section of the report output for one of the MATLAB Function blocks. It shows the block properties table, the summary table for one of the arguments, and a portion of the function script. In the actual output, all of the argument tables appear before the function script.
Find and Report on Stateflow MATLAB Functions
This example shows how to use the StateflowDiagramElementFinder and the slreportgen.report.MATLABFunction reporter to find and report on Stateflow MATLAB functions.
Import the Report and Finder namespaces so that you do not have to use fully qualified class names.
import slreportgen.report.*
import slreportgen.finder.*
Open the model.
model_name = "sf_bus_operations";
load_system(model_name);
chart_name = "sf_bus_operations/Chart";
rpt = slreportgen.report.Report;
Use the StateflowDiagramElementFinder to find all blocks of type emfunction. If you search for all diagram types, the StateflowDiagramElementFinder can take more time to return results than if you limit the search to a particular diagram type.
elemfinder = StateflowDiagramElementFinder(chart_name);
elemfinder.Types = "emfunction";
elems = find(elemfinder);
Loop through the returned MATLAB functions. Create a MATLABFunction reporter for each MATLAB function and add it to a report.
for i = 1:length(elems)
   rptr = MATLABFunction(elems(i).Object);
   add(rpt,rptr);
end
Close and display the report.
close(rpt);
close_system(model_name);
rptview(rpt);
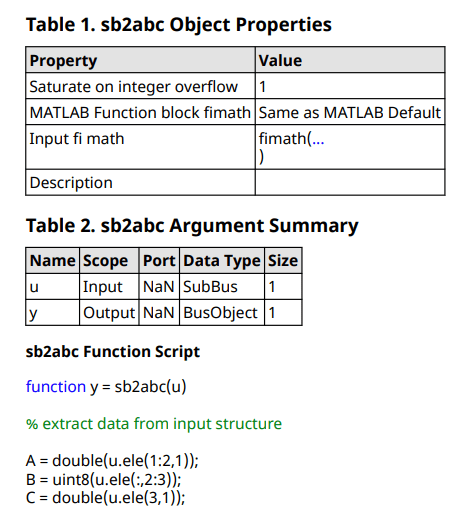
This image shows a section of the report output for the MATLAB Function block.
Customize MATLAB Function Reporter Output
You can customize the output of a MATLAB Function reporter in the same way that you customize any report or reporter:
Use DOM classes — Specify formats using DOM classes, such as
mlreportgen.dom.Paragraph, and use them in your program. For example, this code sets the appearance of the function script.rptr = slreportgen.report.MATLABFunction; paraScript = mlreportgen.dom.Paragraph; paraScript.FontFamilyName = "Arial"; paraScript.FontSize = "12pt"; paraScript.Color = "blue"; rptr.FunctionScript = paraScript;
Edit a copy of the default template — The advantage of saving customizations in a new template is that you can easily reuse those customizations by using that template for another report generator program The template and style sheets for the
MATLABFunctionreporter are located in thematlab\toolbox\shared\slreportgen\rpt\rpt\+slreportgen\+report\@MATLABFunction\resources\templatesfolder.This example shows the steps for copying and editing a
MATLABFunctionreporter html template.Create a copy of the default html template. In this example, the template package is saved as
myHTMLTemplate.htmtxin the current working folder.mfunction = slreportgen.report.MATLABFunction; mfunction.createTemplate("myHTMLTemplate","html");
Unzip the template package. The unzipped template package is a folder of document, style sheet, and image files. In this example, the template package folder is saved to the current working folder.
unzipTemplate("myHTMLTemplate.htmtx");From the
stylesheetsfolder, open theroot.cssfile in a text editor. Theroot.cssfile contains the default styles for theMATLABFunctionreporter. The beginning of the file and the first style are:/******************************************************************
* MATLABFunction Reporter
******************************************************************/
/* Default style for the MATLAB function script title */
.MATLABFunctionFunctionScriptTitle {
font-family: "Noto Sans", "Noto Sans CJK JP", "Noto Sans CJK SC", "Noto Sans CJK KR";
font-weight: bold;
margin-top: 10pt;
color: black;
white-space: pre;
}
Edit the styles as desired. In this example, the top margin above the function script title is increased to 20 points and the color of the title to blue.
/******************************************************************
MATLABFunction Reporter
******************************************************************/
/* Default style for the MATLAB function script title */
.MATLABFunctionFunctionScriptTitle {
font-family: "Noto Sans", "Noto Sans CJK JP", "Noto Sans CJK SC", "Noto Sans CJK KR";
font-weight: bold;
margin-top: 12pt;
color: blue;
white-space: pre;
}
Save the file.
Zip the template folder into a template package. For this example, the template package is
myHTMLTemplate.htmtx.zipTemplate("myHTMLTemplate");In your report generator program, to use the saved template, specify the template source.
mfunction.TemplateSrc = "myHTMLTemplate";
See Templates for DOM API Report Programs for additional information.
See Also
slreportgen.report.MATLABFunction | MATLAB Function | slreportgen.finder.BlockFinder | slreportgen.finder.DiagramElementFinder | slreportgen.finder.StateflowDiagramElementFinder | zipTemplate | unzipTemplate