plotsigroi(msk,x) plots
signal x with color-coded regions based on the source and properties
in msk. If x is complex-valued, the function
plots its magnitude.
Consider a mask of binary sequences for two categories, ran and dom. Use the sequences to generate a signalMask object. Discard regions with fewer than 3 samples.
rng default
sq = randi(2,200,2)-1;
m = signalMask(sq,"MinLength",3,"Categories",["ran""dom"]);
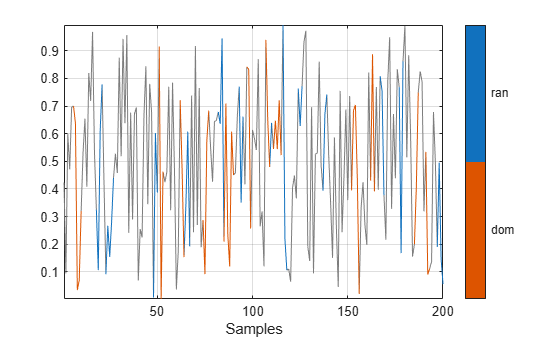
Generate a sequence of 200 random numbers. Plot the regions of interest.
x = rand(200,1);
plotsigroi(m,x)
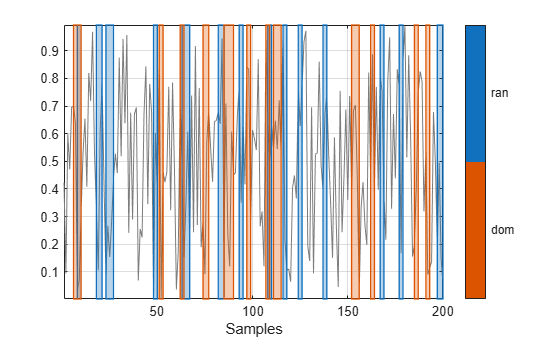
Plot the regions of interest using rectangular patches.
Example: signalMask(table([2 4;6 7],["male" "female"]')) specifies a
signal mask with a three-sample male region and a two-sample
female region.
Example: signalMask(categorical(["" "male" "male" "male" "" "female" "female"
""]',["male" "female"])) specifies a signal mask with a three-sample
male region and a two-sample female
region.
Example: signalMask([0 1 1 1 0 0 0 0;0 0 0 0 0 1 1 0]','Categories',["male"
"female"]) specifies a signal mask with a three-sample
male region and a two-sample female
region.
x — Input signal vector
Input signal, specified as a vector.
Example: chirp(0:1/1e3:1,25,1,50) specifies a chirp sampled at 1
kHz.
Data Types: single | double Complex Number Support: Yes
You clicked a link that corresponds to this MATLAB command:
Run the command by entering it in the MATLAB Command Window.
Web browsers do not support MATLAB commands.
Select a Web Site
Choose a web site to get translated content where available and see local events and offers. Based on your location, we recommend that you select: United States.
You can also select a web site from the following list
How to Get Best Site Performance
Select the China site (in Chinese or English) for best site performance. Other MathWorks country sites are not optimized for visits from your location.