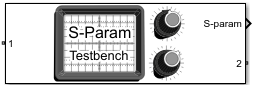
S-Parameter Testbench
Measure S-parameters of system
Libraries:
RF Blockset /
Circuit Envelope /
Testbenches
Description
Use the S-Parameter Testbench block to measure the S-parameter data of a general RF system. The S-parameter testbench sequentially injects a stimulus signal into each port and measures the response at all ports to obtain the scattering matrix of the RF system. While the stimulus should be small signal for meaningful measurement, the testbench allows for large steady state external signals.
Examples
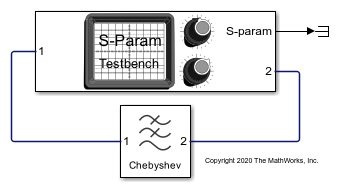
Measure S-Parameter Data of Chebyshev Filter
Use the S-Parameter Testbench block to measure S-parameter data of a ninth-order Chebyshev Tee LC low-pass filter.

Measure S-Parameter of Nonlinear System
Use the S-Parameter Testbench block to measure the S-parameters of a nonlinear system. The system shown here includes a device under test (DUT) with a linear filter followed by a nonlinear amplifier. The system allows an external steady state input that is switched off initially. When the DUT is nonlinear, the stimulus signal created in the S-Parameter Testbench block must be small enough to operate in the linear region.
Parameters
Main
Select to use testbench internal configuration block. Clear this parameter to specify your own configuration block. Clearing this check box removes the Approximate transient as small signal option in the Advanced tab.
Note
When using your own configuration block, parameters such as step size, fundamental tones, harmonic order, and simulate noise may affect the measured results.
Input power to device under test (DUT), specified as a real valued scalar
in dBm. You can change the input power by entering the value in the text box
or selecting a value using the knob. The specified input power represents
the power available at the input ports of the DUT. The valid values are from
-90 through 60 dBm.
This parameter is disabled while simulation is running when the Approximate transient as small signal option is checked in the Advanced tab.
Data Types: double
Number of measured ports, specified as a scalar integer limited to the range 1:128. Once you change the number of ports, new ports appear on the block.
Data Types: double
Select to measure entire S-parameters matrix. This measurement is done by sequentially exciting each port and measuring all the ports for the output. When you select this box, Save measurement result to .s2p button appears below this parameter. In this case, the output signal S-parameters are of dimension N-by-N-by-F. N is the number of ports and F is the number of frequencies.
Clear this parameter to manually specify the S-parameters elements. In this case, the output signal S-parameters are of dimension M-by-F. M is the total number of S-parameter elements and F is the number of frequencies.
Click to save the measured S-parameters data to a Touchstone file. This
button opens a standard dialog box for browsing and choosing a file. The
only file type suggested is .sNp,
where N is the number of measured ports. This button is
disabled before the first simulation takes place and while simulations are
running or initializing. It captures the results of the previous
simulations. The N value in .sNp
corresponds to the number of ports previously measured.
Dependencies
To enable this parameter, select Measure all S-parameters.
S-parameter elements to measure, specified as a two-column matrix. Each
row represents an S-parameter element. The first column represents the
incident wave port and the second column represents the scattered wave port.
For example, [[2 1];[1 1]] indicates a two element
measurement: S21 and S11. You can choose any elements from the matrix in any
order, but the elements must be unique.
Dependencies
To enable this parameter, clear Measure all S-parameters.
Data Types: double
Variable name to store the measurement data in MATLAB® workspace, specified as a character vector. The data is stored
as an RF Toolbox™
sparameters object.
Data Types: char
Carrier frequency of the DUT, specified as a scalar in Hz. By default, output frequency is equal to the input frequency because S-parameters are measured to quantify linear systems.
For small-signal measurements over large constant external signals, you can specify an output frequency in the Advanced tab when Adjust for steady-state external signals is selected.
Data Types: double
Baseband bandwidth of input signal, specified as a positive finite scalar in Hz. The measured frequencies reside on this band around the input carrier frequency. This band is by default narrower than the solver envelope bandwidth to keep simulation artifacts outside of the measured results. The ratio of the two bands can be controlled using Ratio of Envelope to Baseband bandwidths in the Advanced tab.
Data Types: double
Impedance for S-parameter measurement, specified as a positive finite scalar in ohms. All ports are measured using the same reference impedance.
Data Types: double
Select to view measured values of specified S-parameters over the
specified frequency bandwidth using a spectrum analyzer. You can view two
types of curves in the plot: Magnitude or
Real & Imag. The
Magnitude plot shows the s-parameter data
magnitudes is in dBm. Real & Imag shows both
the real and imaginary parts of the S-parameters. The real and imaginary
plot of the S-parameters has no units.
Note
To view the S-parameters spectrum using a Spectrum Analyzer, you need a DSP System Toolbox™ license.
Select to internally ground and hide the negative terminals. Clear to expose the negative terminals. By exposing these terminals, you can connect them to other parts of your model.
Advanced
Number of FFT bins used for measurements, specified as a scalar integer power of 2. The value must be an integer power of 2. This value controls the spectral resolution of measurements over the specified bandwidths.
This parameter is read-only.
Total time duration in which each port output is measured to get the spectral result, specified as a scalar integer. The value is the ratio of FFT Length over the Baseband bandwidth specified in the Main tab. It lets you know that any system response beyond this value is not included in the spectral result. This bound is an outcome of the spectral resolution limitation.
Intermission between sequential measurements where the port excitation varies, specified as a scalar integer number of Measurement time instances. Similar to real measurements, the DUT cannot be reset to clear its internal states. By switching between measurements too fast, outputs that extend beyond the Measurement time can be collected in the next measurement. This value helps to avoid the contamination of the next measurement.
Ratio between internal solver envelope bandwidth and measured bandwidth, specified as a scalar integer power of 2.
Select to adjust for large steady-state external signals and measure only the linear effect of the DUT for small signal stimulus injected by the testbench. This means that the DUT can contain elements that mix with large signals that are constant-in-time over the envelope at each carrier. When you select this parameter, you can specify an output frequency different from the input frequency.
Clear this if there are no signals injected to the DUT external to the testbench.
Note
The DUT should not contain any external signals that are time varying over the envelope at each carrier.
Output carrier frequency, specified as a positive finite scalar.
Dependencies
To enable this parameter, select Adjust for steady state external signals.
Select this option to choose a small subset of frequencies for transient small signal analysis. Use this parameter to accelerate the measurement of S-parameters of the large nonlinear systems around a given operation point specified by large external steady-state signals.
Select this option to use all frequencies automatically chosen for a full-harmonic balance nonlinear solution. Clear to specify the frequencies that carry the small-signal transient.
Dependencies
To enable this parameter, check Approximate transient as small signal.
Frequencies that carry the small signal transient, specified as a real scalar integer or vector. The specified frequencies should be contained in the entire set of simulation frequencies. If some frequencies are not contained, a warning message appears. If all frequencies are not contained, an error message appears.
Dependencies
To enable this parameter, clear Use all steady-state simulation frequencies for small signal analysis.
Open the tool to choose small signal transient frequencies to populate Small signal frequencies. The selected frequencies are a subset of the simulation frequencies determined from Fundamental tones and Harmonic order used in simulation. The entire set of simulation frequencies are given in the combo box on the right side of the dialog box, and the selected frequencies are highlighted. You can select by directly choosing the frequencies in the selection box, or by choosing the desired tones and harmonic order in the Small signal selection panel and clicking Select. The Tones (Hz) and Harmonic order values in the combo boxes are also populated using Fundamental tones and Harmonic order used in simulation.

Dependencies
To expose this parameter, clear Use all steady-state simulation frequencies for small signal analysis.
References
[1] Razavi, Behzad. RF Microelectronics. Upper Saddle River, NJ: Prentice Hall, 2011.
Version History
Introduced in R2019b