Main Content

add

R2026b

Import data into existing run in Simulation Data Inspector using Simulink.sdi.Run object

Description

Import Data from Workspace

add(runObj,var) imports the data in the variable var into the Simulation Data Inspector by adding a signal to the run that corresponds to the specified Simulink.sdi.Run object.

To import data into a new run, use the Simulink.sdi.Run.create function or the Simulink.sdi.createRun function.

add(runObj,'vars',var1,var2,...,varn) imports data from one or more variables into the Simulation Data Inspector by adding one or more signals to the run that corresponds to the specified Run object.

example

add(runObj,'namevalue',sourceNames,sigValues) imports data from one or more variables into the Simulation Data Inspector by adding one or more signals to the run that corresponds to the specified Run object. The sourceNames argument specifies values to use for the data source in the metadata for the signals added to the run.

Import Data from File

add(runObj,'file',filename) imports data from a file into the Simulation Data Inspector by adding one or more signals to the run that corresponds to the specified Run object. You can use a built-in file reader to import data from a MAT file, CSV file, Microsoft® Excel® file, or MDF file.

When you need to import data from a file that the built-in readers do not support, you can write your own reader using the io.reader class.

add(runObj,'file',filename,Name=Value) imports data from a file into the Simulation Data Inspector by adding one or more signals to the run that corresponds to the specified Run object. For example, sheets=["sheet1" "sheet2"] specifies the sheets from which to import data when importing data from an Excel file.

Examples

collapse all

Create a run, add data to it, and then view the data in the active tab of the Simulation Data Inspector.

Create Data for Run

Create two timeseries objects to contain data for a sine signal and a cosine signal. Give each timeseries object a descriptive name.

time = linspace(0,20,101);

sine_vals = sin(2*pi/5*time);
sine_ts = timeseries(sine_vals,time);
sine_ts.Name = "Sine, T=5";

cos_vals = cos(2*pi/8*time);
cos_ts = timeseries(cos_vals,time);
cos_ts.Name = "Cosine, T=8";

Create Run and Add Data

To open the Simulation Data Inspector, use Simulink.sdi.view.

Simulink.sdi.view

To import data into the Simulation Data Inspector from the workspace, create a Simulink.sdi.Run object using Simulink.sdi.Run.create. Add metadata information using the Name and Description properties of the Run object.

sinusoidsRun = Simulink.sdi.Run.create;
sinusoidsRun.Name = "Sinusoids";
sinusoidsRun.Description = "Sine and cosine signals with different frequencies";

Add the data you created in the workspace to the empty run.

add(sinusoidsRun,"vars",sine_ts,cos_ts);
 0.091530s wall, 0.156250s user + 0.031250s system = 0.187500s CPU (204.9%)

Plot Data in Simulation Data Inspector

To access the Simulink.sdi.Signal object corresponding to each signal, use getSignalByIndex. You can use the Simulink.sdi.Signal object properties to specify the line style and color for the signal and plot the signal in the Simulation Data Inspector. For example, specify the LineColor and LineDashed properties for each signal.

sine_sig = getSignalByIndex(sinusoidsRun,1);
sine_sig.LineColor = [0 0 1];
sine_sig.LineDashed = "-.";

cos_sig = sinusoidsRun.getSignalByIndex(2);
cos_sig.LineColor = [1 0 0];
cos_sig.LineDashed = "--";

To configure a 2-by-1 subplot layout in the active tab of the Simulation Data Inspector plotting area, use Simulink.sdi.setSubPlotLayout. To plot the sine signal on the upper subplot and the cosine signal on the lower subplot, use plotOnSubPlot.

Simulink.sdi.setSubPlotLayout(2,1);

plotOnSubPlot(sine_sig,1,1,true);
plotOnSubPlot(cos_sig,2,1,true);
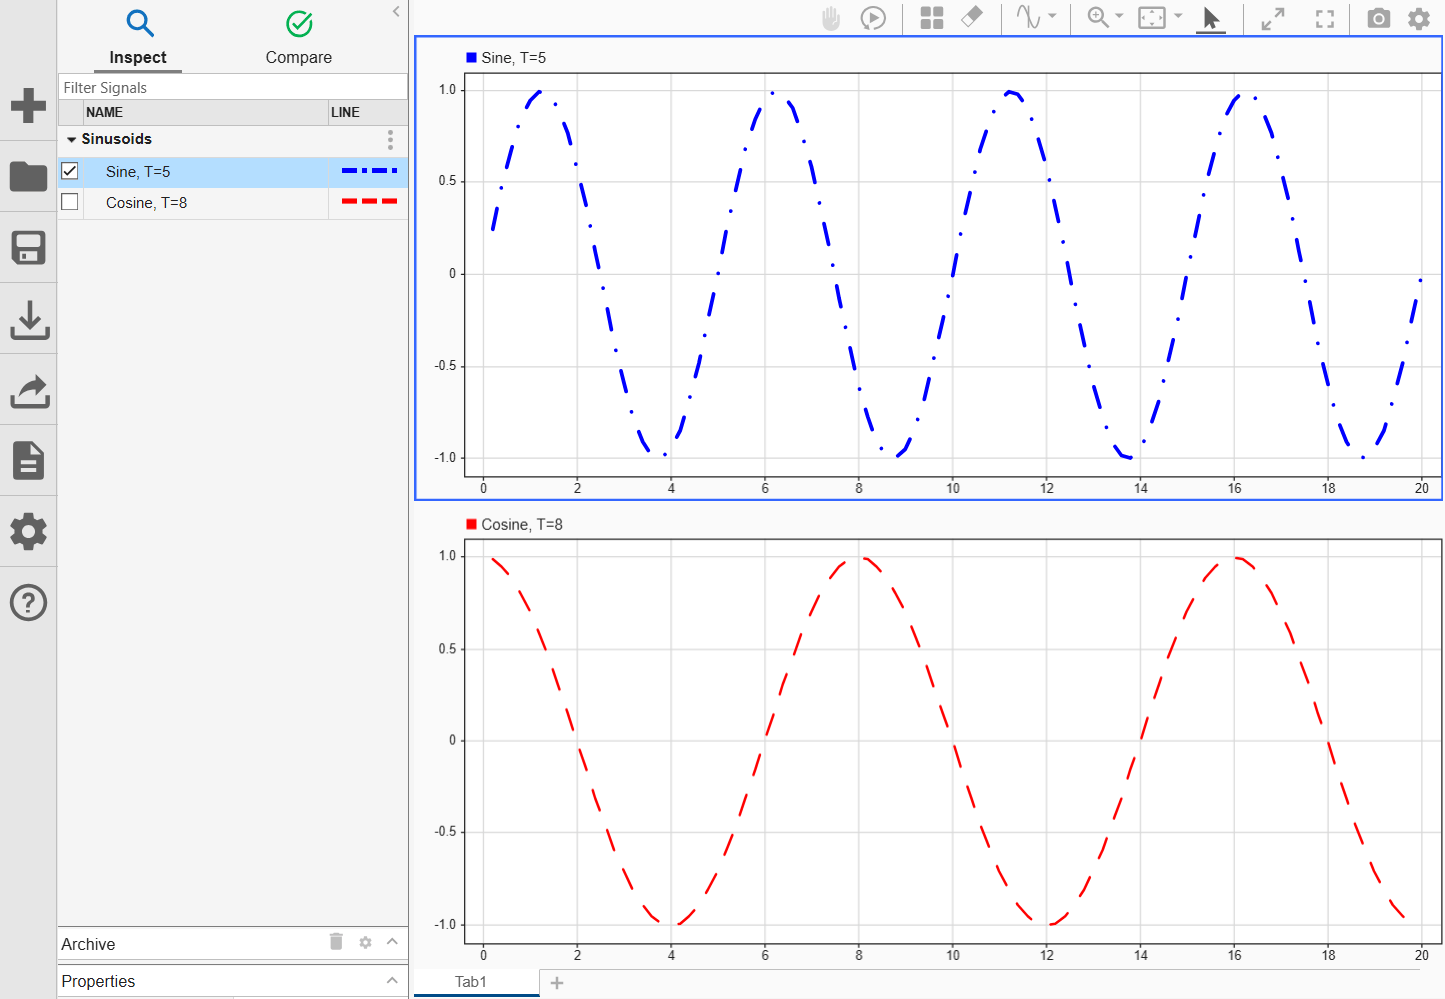
A 2-by-1 subplot layout for Tab1 in the Simulation Data Inspector. The sine signal is plotted in the upper subplot and the cosine signal is plotted in the lower subplot.

Inspect Data Using Cursors

To access the value of a signal at a specific time, you can add a cursor to the plot. For example, the Sine signal appears to have a local maximum at about 6 seconds. Add one cursor to the plot and observe the signal value at 6 seconds.

Simulink.sdi.setNumCursors(1)
Simulink.sdi.setCursorPositions("left",6)
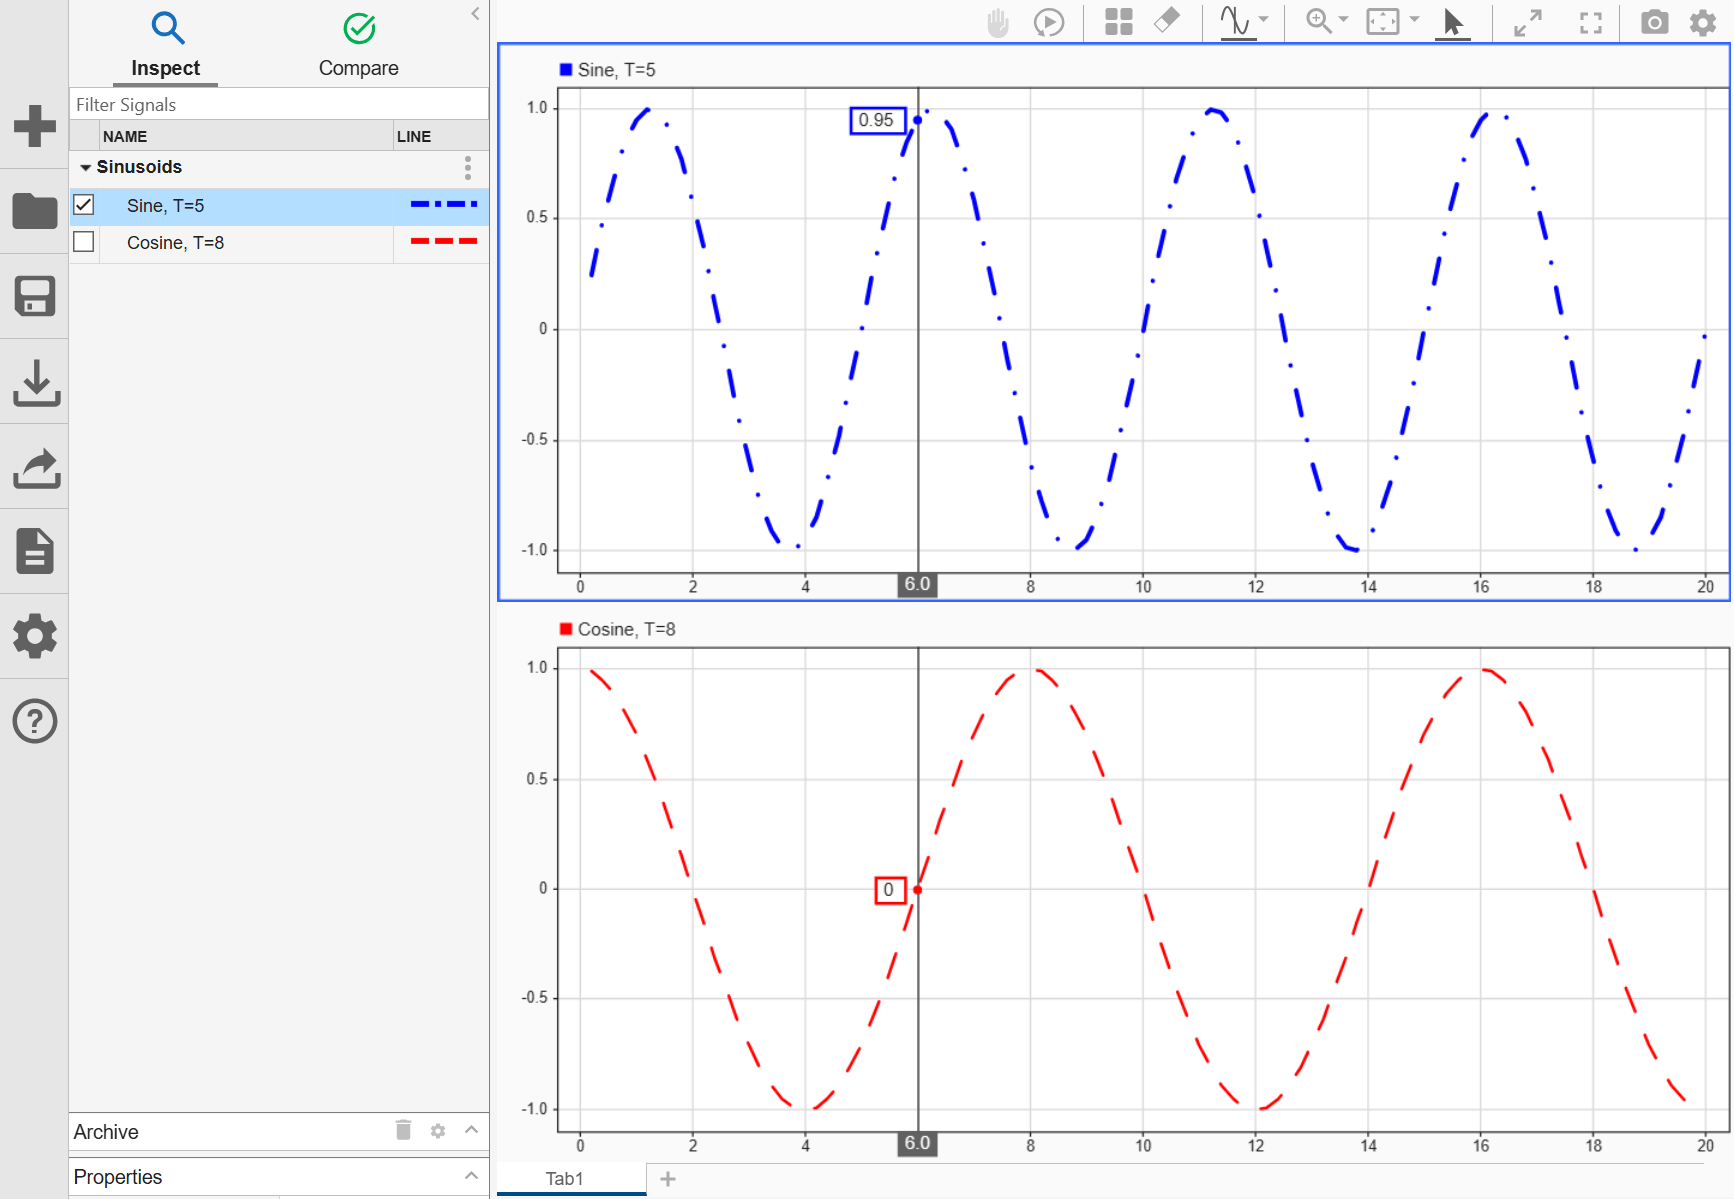
The Simulation Data Inspector with a cursor positioned at 6 seconds in Tab1. The cursor is applied to both subplots.

To measure the time difference between two points or extract descriptive statistics within the defined interval, add two cursors.

Simulink.sdi.setNumCursors(2)
Simulink.sdi.setCursorPositions("left",5,"right",7)
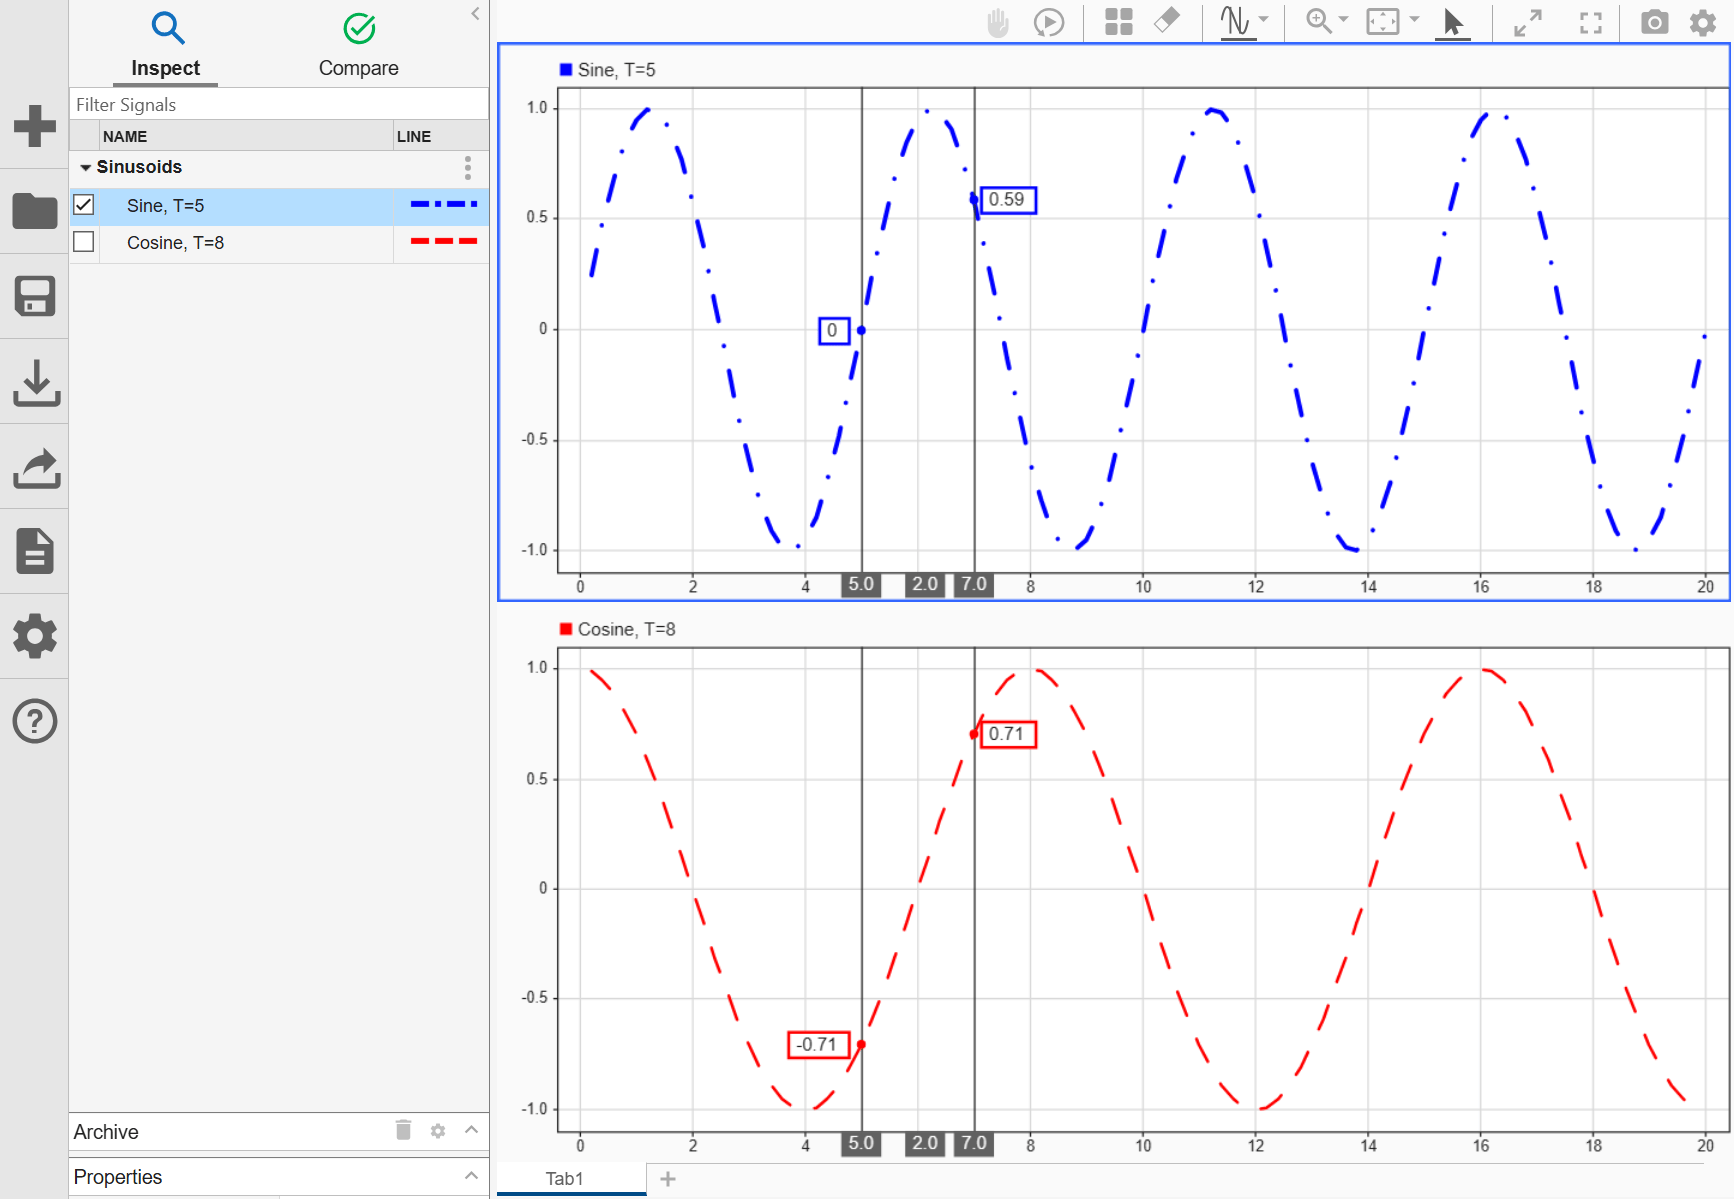
The Simulation Data Inspector with two cursors positioned at 5 seconds and 7 seconds in Tab1.

Determine the local maximum sample value in the Sine signal between the cursors using the max function.

[t1,t2] = Simulink.sdi.getCursorPositions;
localMax = max(sine_sig,t1,t2)
localMax = 
0.9980

Close Simulation Data Inspector and Save Data

When you finish inspecting the plotted signal data, you can close the Simulation Data Inspector and save the session to an MLDATX file.

Simulink.sdi.close("sinusoids.mldatx")

Input Arguments

collapse all

Run to which you want to add imported data, specified as a Simulink.sdi.Run object.

Variable to import. The Simulation Data Inspector supports time-based data in which sample values are associated with sample times. The Simulation Data Inspector supports all loading and logging data formats, including timeseries and Simulink.SimulationData.Dataset.

Example: myVar

Data to import, specified as one or more variables. The Simulation Data Inspector supports time-based data in which sample values correspond to sample times. The Simulation Data Inspector supports all loading and logging data formats, including timeseries and Simulink.SimulationData.Dataset.

Example: myData

Source names for imported data, specified as a cell array of character vectors. The source name is used to set the RootSource, TimeSource, and DataSource properties of the Simulink.sdi.Signal objects created from the data specified by the sigValues input.

Provide a sourceNames input when you specify "namevalue" for the second argument.

Example: {'sig1','sig2'}

Data to import, specified as a cell array of variables.

Provide a sigValues input when you specify "namevalue" for the second argument.

Example: {var1,var2}

Name of file with data to import, specified as a character vector. Provide a filename input when you specify "file" for the second argument.

You can create a run from these types of files using file readers built into the Simulation Data Inspector:

When you need to import data from a file that the built-in readers do not support, you can write your own reader using the io.reader class. You can also write a custom reader to use instead of the built-in reader for any file extension. For an example, see Import Data Using Custom File Reader.

Example: 'simulation.mat'

Name-Value Arguments

collapse all

Specify optional pairs of arguments as Name1=Value1,...,NameN=ValueN, where Name is the argument name and Value is the corresponding value. Name-value arguments must appear after other arguments, but the order of the pairs does not matter.

Example: Sheets=["sheet1" "sheet2"]

File reader to use to import data, specified as a string or character vector.

The Simulation Data Inspector prioritizes using a registered custom reader if one is available for the file. If you do not specify a reader, the Simulation Data Inspector uses the first custom reader registered for the file. If no custom readers are registered, the Simulation Data Inspector imports the data using the built-in reader.

Specify the reader input when:

  • You want to use the built-in reader to import data for a file that is also supported by a custom reader.

  • Multiple registered custom readers support the file.

To determine which readers are available to import your file, use the io.reader.getSupportedReadersForFile function.

Example: Reader="MyExcelReader"

Example: Reader="built-in"

Sheets in Excel file from which to import data, specified as a string array or a cell array of character vectors. By default, the Simulation Data Inspector imports data from all sheets. Specify Sheets to limit the import to specific sheets.

If the data in the file does not include simulation numbers and source information, the Simulation Data Inspector imports the data on each sheet into a separate run. For more information about formatting data to import from an Excel file, see Microsoft Excel Import, Export, and Logging Format.

Example: Sheets=["sheet1" "sheet2"]

Model with definitions of user-defined data types, specified as a string or character vector.

If you load data from a CSV or Excel file that defines signal data types using user-defined data types, such as enumerations, buses, or aliases, the Simulation Data Inspector requires access to the type definition to import the data. You can provide access to the type definitions by:

  • Loading the associated object into the MATLAB® workspace.

  • Specifying the Model name-value argument to use type definitions saved in the model workspace or a data dictionary.

For information about formatting data to import, see CSV File Format for Simulation Data or Microsoft Excel Import, Export, and Logging Format.

Example: Model="myModel.slx"

Names of signals to import from a Parquet file, specified as a string, string array, character vector, or cell array of character vectors. By default, the Simulation Data Inspector imports all signals from the file. To selectively import specific signals, use the SignalNames or ColumnIndices name-value argument.

Signal names must match exactly and are case-sensitive. To identify the signal names available in a Parquet file, use Simulink.sdi.Parquet.getSignalMetadata.

To import all elements of a bus, specify the bus parent name. For example, to import all elements from a bus named VehicleBus, specify SignalNames="VehicleBus". To import only some elements of a bus, use dot notation. For example, SignalNames="VehicleBus.Velocity" imports only the Velocity element.

Example: SignalNames=["Sine" "Cosine"]

Column indices of signals to import from a Parquet file, specified as a positive integer or vector of positive integers. By default, the Simulation Data Inspector imports all signals from the file. To selectively import specific signals, use the SignalNames or ColumnIndices name-value argument.

Column indices refer to data columns only. The Simulation Data Inspector automatically imports time columns with the corresponding data columns. To identify the column indices for signals in a Parquet file, use Simulink.sdi.Parquet.getSignalMetadata.

Example: ColumnIndices=[1 3 5]

Version History

Introduced in R2017b