Change Model Advisor Checks in Metrics Dashboard
The Metrics Dashboard can collect and display metric results that help you to assess the guideline compliance of your model. When you run the metrics in the Metrics Dashboard, the dashboard can run groups of Model Advisor checks, analyze code with MATLAB® Code Analyzer, and report on Simulink® diagnostic results. The dashboard shows these metric results in the Modeling Guideline Compliance group. You can use these metric results to monitor warnings and issues with your model compliance.
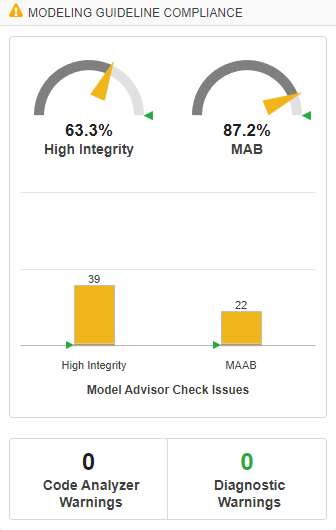
By default, the dial widgets and bar chart widget in the Modeling Guideline Compliance group use metric data from two groups of Model Advisor checks: High-Integrity Systems and Modeling Standards for MAB. You can customize the Modeling Guideline Compliance group to display different metric results, use different metric thresholds, or remove specific widgets.
This example shows how to change the MAB dial widget and MAAB bar in the bar chart widget to show metric results for a check group other than the default. For information on how to remove widgets or change metric thresholds, see Rearrange and Remove Widgets in Metrics Dashboard and Modify, Remove, and Add Metric Thresholds in Metrics Dashboard.
Create Metric IDs for Custom Model Advisor Metrics
If you want the Metrics Dashboard to collect metric results for a specific Model Advisor check group, create a custom Model Advisor metric that runs the checks and calculates metric results. To create a custom Model Advisor metric, you need to create a metric ID.
The metric ID for a custom Model Advisor metric must be in the form <Family ID>.<Check Group ID>. The Family ID defines the type of data that the metric returns. The Check Group ID defines which Model Advisor check group the metric runs and analyzes.
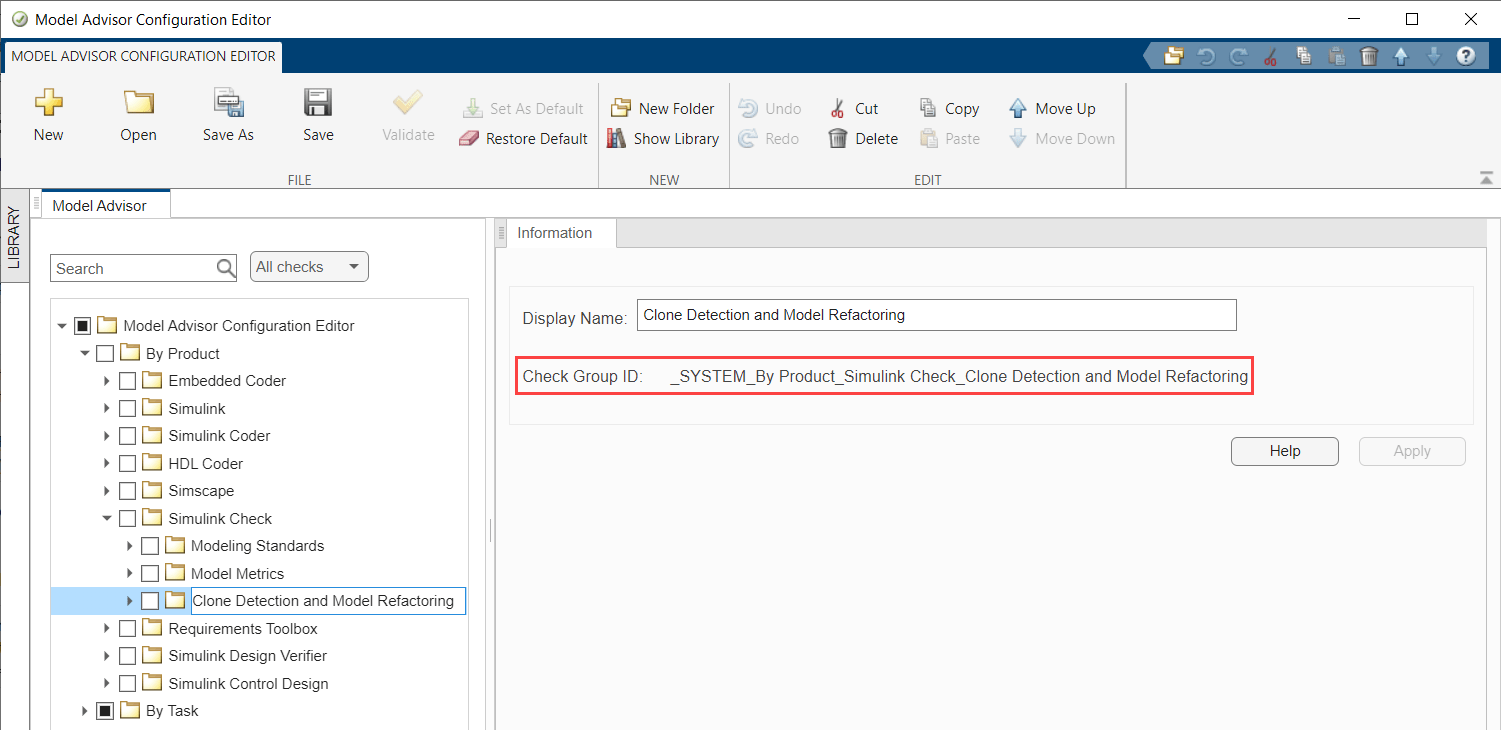
1. Find the Check Group ID for a check group by opening the Model Advisor Configuration Editor and selecting the desired check group folder. You can use the function Simulink.ModelAdvisor.openConfigUI to open the Model Advisor Configuration Editor.
Simulink.ModelAdvisor.openConfigUI
For this example, suppose you want to find the Check Group ID for the Model Advisor check group Clone Detection and Model Refactoring. In the Model Advisor pane, select Model Advisor Configuration Editor > By Product > Simulink Check > Clone Detection and Model Refactoring. When you select the folder, the Information tab shows that the Check Group ID is _SYSTEM_By Product_Simulink Check_Clone Detection and Model Refactoring.
For more information on check groups and the Model Advisor Configuration Editor, see Use Model Advisor Configuration Editor to Customize Model Advisor.
2. Save the Check Group ID as a string variable in the workspace.
checkGroupID = "_SYSTEM_By Product_Simulink Check_Clone Detection and Model Refactoring";When you create the metric ID for your custom Model Advisor metric, you can specify the Family ID as either:
mathworks.metrics.ModelAdvisorCheckCompliance— The metric returns the fraction of passing checks in the check group specified by the Check Group ID.mathworks.metrics.ModelAdvisorCheckIssues— The metric returns the number of issues reported by the check group specified by the Check Group ID.
3. Create a custom Model Advisor metric ID for a metric that returns the fraction of passing checks in the check group.
metricID_for_Fraction_Passed = strcat("mathworks.metrics.ModelAdvisorCheckCompliance.",checkGroupID);4. Create a custom Model Advisor metric ID for a metric that returns the number of issues reported by the check group.
metricID_for_Number_of_Issues = strcat("mathworks.metrics.ModelAdvisorCheckIssues.",checkGroupID);Access Widgets You Want to Change
The dashboard configuration determines where and how widgets appear in the Metrics Dashboard. You can create a dashboard configuration object and use the object to access the widgets in the layout.
1. Open the default dashboard configuration and save the configuration object to the base workspace.
dashboardconfig = slmetric.dashboard.Configuration.openDefaultConfiguration();
2. Get the widget layout from the dashboard configuration. The layout contains several layers of dashboard objects.
layout = getDashboardLayout(dashboardconfig);
3. Use the getWidgets function to get the dashboard objects that are at the top level of the layout.
layoutWidget = getWidgets(layout);
The top level of the default layout contains widgets that show information about the current model and size, architecture, and modeling guideline compliance metrics. The Modeling Guideline Compliance group is the third group at the top level of the layout.
4. Get the Modeling Guideline Compliance group.
complianceGroup = layoutWidget(3);
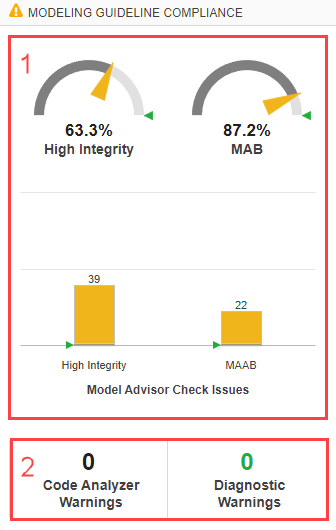
The Modeling Guideline Compliance group contains two containers:
The top container contains the dial widgets and bar charts.
The bottom container contains the warnings widgets.
In this diagram, the red numbers 1 and 2 indicate the top and bottom containers respectively. There are three widgets in the top container: the High Integrity dial widget, MAB dial widget, and Model Advisor Check Issues bar chart.
To view the widgets in the top and bottom containers, you can open the Metrics Dashboard by entering:
metricsdashboard vdp
5. Use the getWidgets function to get the two containers in the Modeling Guideline Compliance group.
complianceContainers = getWidgets(complianceGroup);
6. Get the top container.
topContainer = complianceContainers(1);
7. Get the widgets in the top container.
topContainerWidgets = getWidgets(topContainer);
8. Get the MAB dial widget and the Model Advisor Check Issues bar chart from the top container.
dialwidget = topContainerWidgets(2);
barChartWidget = topContainerWidgets(3);
Assign Custom Model Advisor Metrics to Widgets
The metric configuration determines the metric IDs that you can assign to widgets in the Metrics Dashboard. You can update the metric configuration, assign your custom Model Advisor metric IDs to the widgets, and update the widget attributes to work for your custom Model Advisor metrics. Note that metric configuration does not use the Model Advisor configuration file to determine which checks to run. If you have specified a custom Model Advisor configuration, the Metrics Dashboard runs the checks specified by your metric configuration, even if you do not select those checks in your Model Advisor configuration file.
1. Open the default metric configuration and save the configuration object to the base workspace.
metricconfig = slmetric.config.Configuration.openDefaultConfiguration();
2. Update the metrics configuration to recognize the Clone Detection and Model Refactoring Check Group ID. The Modeling Guideline Compliance group can only get metric results for check groups that you specify with the ModelAdvisorStandard argument of the function setMetricFamilyParameterValues.
originalCheckGroupIds = {'maab', 'hisl_do178'};
CheckGroupIDs = [originalCheckGroupIds checkGroupID];
setMetricFamilyParameterValues(metricconfig,ModelAdvisorStandard=CheckGroupIDs);
3. Update the dial widget to report the fraction of passing checks in the Clone Detection and Model Refactoring check group, instead of the default Modeling Standards for MAB check group.
setMetricIDs(dialwidget,metricID_for_Fraction_Passed);
dialwidget.Labels = "Clones and Refactoring";
dialwidget.Title = "Clone/Refactor";
The dial widget accepts fractional data values between zero and one, but displays the data as a percentage in the dashboard.
4. Update the bar chart widget to report the number of check issues from the Clone Detection and Model Refactoring check group, instead of the default Modeling Standards for MAB check group.
setMetricIDs(barChartWidget,metricID_for_Number_of_Issues);
barChartWidget.Labels = "Issues";
barChartWidget.Title = "Clone Detection and Model Refactoring Issues";
5. Save the updated dashboard and metric configurations, set the configurations as the active configurations, and open the Metrics Dashboard to see the updated dashboard layout.
save(dashboardconfig,'Filename','DashboardConfig.xml');
slmetric.dashboard.setActiveConfiguration(fullfile(pwd,'DashboardConfig.xml'));
save(metricconfig,'FileName','MetricConfig.xml');
slmetric.config.setActiveConfiguration(fullfile(pwd,'MetricConfig.xml'));
metricsdashboard vdp
To run the metrics and view the metric results, click All Metrics in the toolstrip.
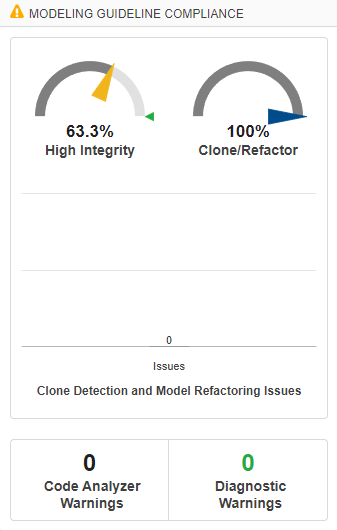
For the model vdp, the dial widget shows that 100% of the checks in the Clone Detection and Model Refactoring check group pass and the bar chart shows that there are zero check issues in the Clone Detection and Model Refactoring check group. The dial widget appears blue because there are no metric thresholds associated with the custom Model Advisor metric. For information on how to add or change metric thresholds, see Modify, Remove, and Add Metric Thresholds in Metrics Dashboard.
For more information on metrics dashboard customization, see Customize Metrics Dashboard Layout and Functionality.