gline
Add line to plot interactively
Description
gline lets you select two points interactively in the current
figure, and draws a line between the two points. When you click the first point, a line
tracks the pointer movement until you click the second point to complete the line.
gline( adds a line to the figure specified
by f)f instead of the current figure.
g = gline(___)Line object. Use g to modify the properties of the
line after you create it. For a list of properties, see Line Properties.
Examples
Connect two points in a plot by using the gline
function.
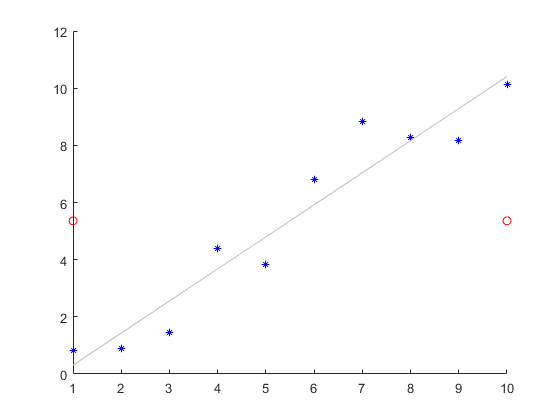
Generate a sample data set, and create a scatter plot.
x = 1:10;
y = x + randn(1,10);
scatter(x,y,25,"b","*")
Superimpose a least-squares line on the scatter plot.
lsline
Plot red circle markers.
mu = mean(y);
hold on
scatter([1 10],[mu mu],"ro")
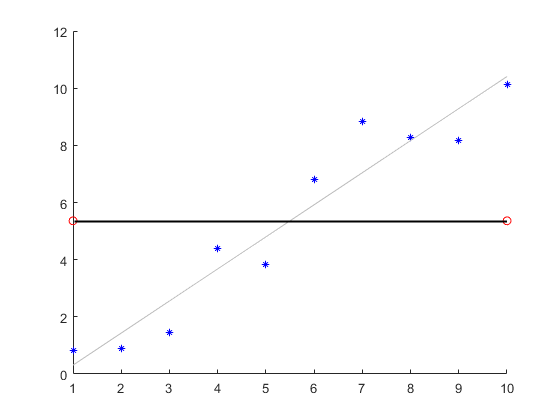
Start the interactive line tool by calling the gline function for
the current figure.
g = gline;
Connect the two circle markers by selecting them. First, click one of the markers. A line appears and tracks the pointer movement. Then click the second marker to complete the line.
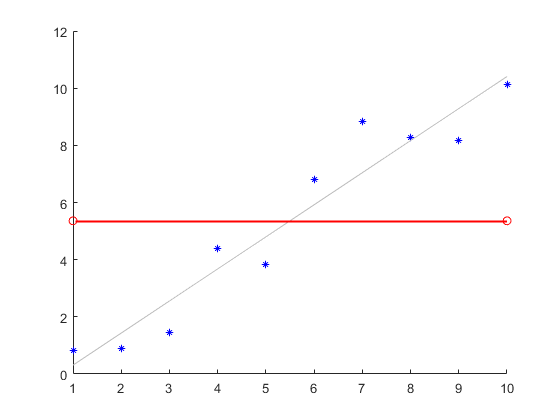
Modify the line color by using g.
set(g,"Color","r")
Input Arguments
Version History
Introduced before R2006a