fcontour
R2026bPlot contours of symbolic expression
Syntax
Description
fcontour( plots the contour lines
of symbolic expression f(x,y) over the default interval of f)x and
y, which is [-5 5].
fcontour( plots f,[xmin xmax
ymin ymax])f over the interval
xmin < x <
xmax and ymin <
y < ymax. The fcontour function uses
symvar to order the variables and assign intervals.
fcontour(___,
uses LineSpec)LineSpec to set the line style and color.
fcontour doesn’t support markers.
fcontour(___,
specifies line properties using one or more name-value arguments. Use this
option with any of the input argument combinations in the previous syntaxes.
Name-value settings apply to all the lines plotted. To set options for
individual plots, use the objects returned by
Name=Value)fcontour.
fcontour( plots
into the axes object ax,___)ax instead of the current axes object
gca.
fc = fcontour(___)
Examples
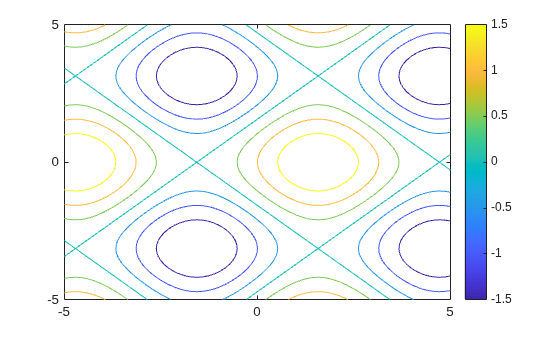
Plot the contours of over the default range of and . Show the colorbar. Find a contour's level by matching the contour's color with the colorbar value.
syms x y
fcontour(sin(x) + cos(y))
colorbar
Plot the contours of over the default range of and .
syms f(x,y)
f(x,y) = sin(x) + cos(y);
fcontour(f)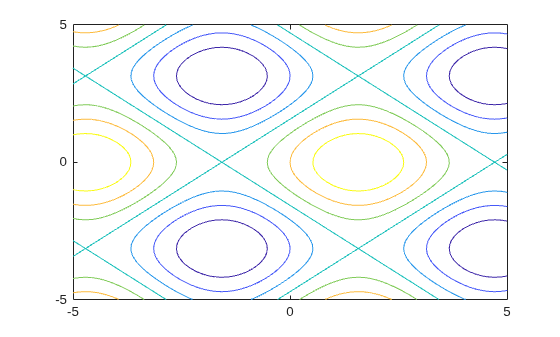
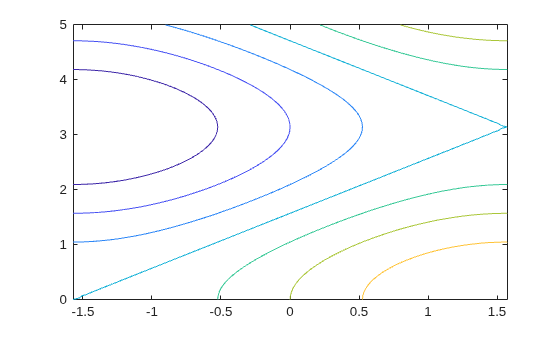
Plot over and by specifying the plotting interval as the second argument of fcontour.
syms x y
f = sin(x) + cos(y);
fcontour(f,[-pi/2 pi/2 0 5])
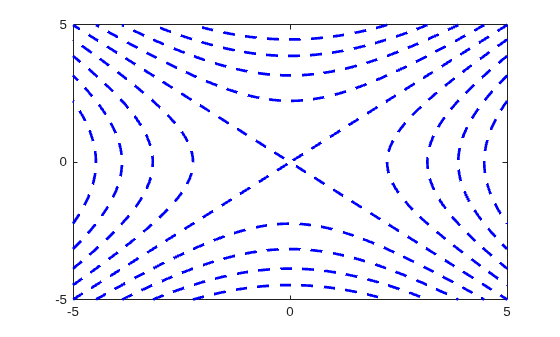
Plot the contours of as blue, dashed lines by specifying the LineSpec input. Specify a LineWidth of 2. Markers are not supported by fcontour.
syms x y
fcontour(x^2 - y^2,'--b',LineWidth=2)
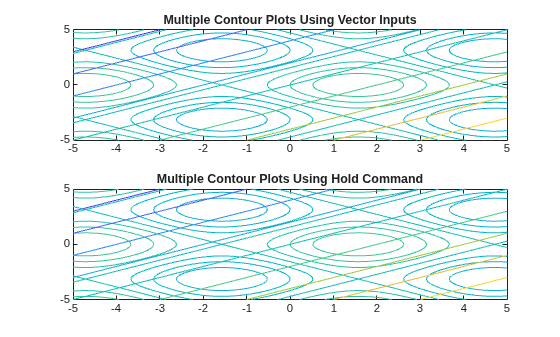
Plot multiple contour plots either by passing the inputs as a vector or by using hold on to successively plot on the same figure. If you specify LineStyle and Name-Value arguments, they apply to all contour plots. You cannot specify individual LineStyle and Name-Value pair arguments for each plot.
Divide a figure into two subplots by using subplot. On the first subplot, plot and by using vector input. On the second subplot, plot the same expressions by using hold on.
syms x y
subplot(2,1,1)
fcontour([sin(x)+cos(y) x-y])
title('Multiple Contour Plots Using Vector Inputs')

subplot(2,1,2)
fcontour(sin(x)+cos(y))
hold on
fcontour(x-y)
title('Multiple Contour Plots Using Hold Command')

hold off
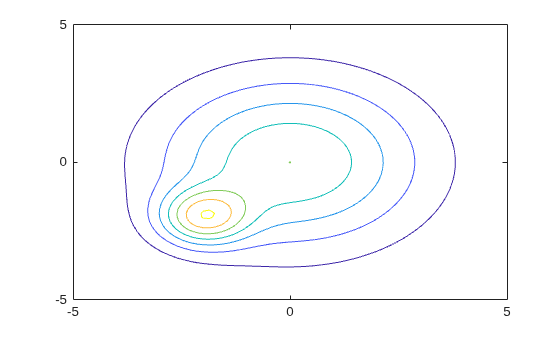
Plot the contours of . Specify an output to make fcontour return the plot object.
syms x y
f = exp(-(x/3)^2-(y/3)^2) + exp(-(x+2)^2-(y+2)^2);
fc = fcontour(f)
fc =
  FunctionContour with properties:

     Function: exp(- x^2/9 - y^2/9) + exp(- (x + 2)^2 - (y + 2)^2)
    LineColor: 'flat'
    LineStyle: '-'
    LineWidth: 0.5000
         Fill: off
    LevelList: [0.2000 0.4000 0.6000 0.8000 1 1.2000 1.4000]

  Show all properties
Change the LineWidth to 1 and the LineStyle to a dashed line by using dot notation to set properties of the object fc. Visualize contours close to 0 and 1 by setting LevelList to [1 0.9 0.8 0.2 0.1].
fc.LineStyle = '--';
fc.LineWidth = 1;
fc.LevelList = [1 0.9 0.8 0.2 0.1];
colorbar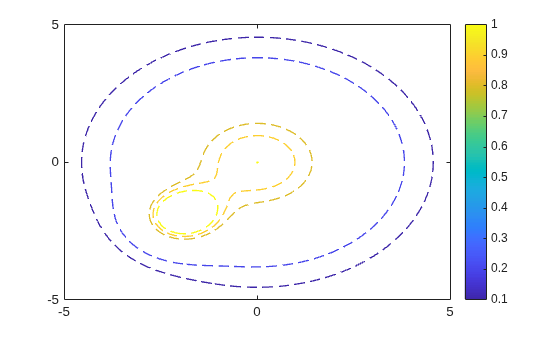
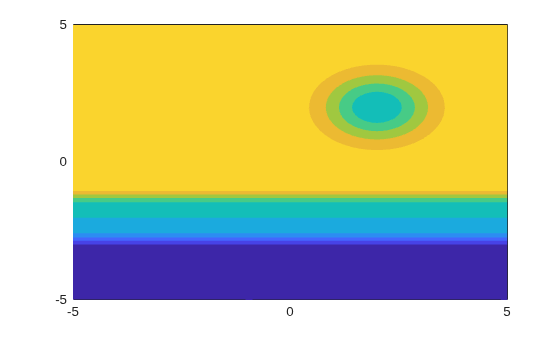
Fill the area between contours by setting the Fill input of fcontour to "on". If you want interpolated shading instead, use the fsurf function with its option EdgeColor set to "none" followed by the command view(0,90).
Create a plot that looks like a sunset by filling the contours of
syms x y
f = erf((y+2)^3) - exp(-0.65*((x-2)^2+(y-2)^2));
fcontour(f,Fill="on")
Set the values at which fcontour draws contours by using the LevelList option.
syms x y
f = sin(x) + cos(y);
fcontour(f,LevelList=[-1 0 1])
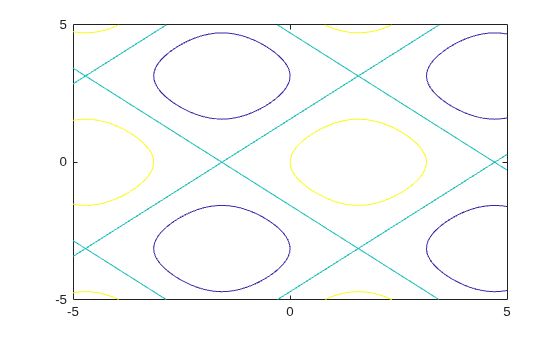
Control the resolution of contour lines by using the MeshDensity option. Increasing MeshDensity can make smoother, more accurate plots while decreasing it can increase plotting speed.
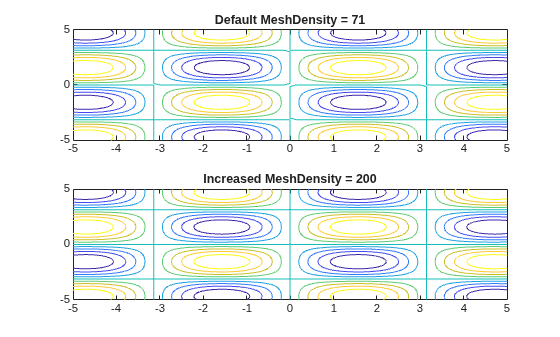
Divide a figure into two using subplot. In the first subplot, plot the contours of . The corners of the squares do not meet. To fix this issue, increase MeshDensity to 200 in the second subplot. The corners now meet, showing that by increasing MeshDensity you increase the plot's resolution.
syms x y
subplot(2,1,1)
fcontour(sin(x).*sin(y))
title('Default MeshDensity = 71')

subplot(2,1,2)
fcontour(sin(x).*sin(y),MeshDensity=200)
title('Increased MeshDensity = 200')
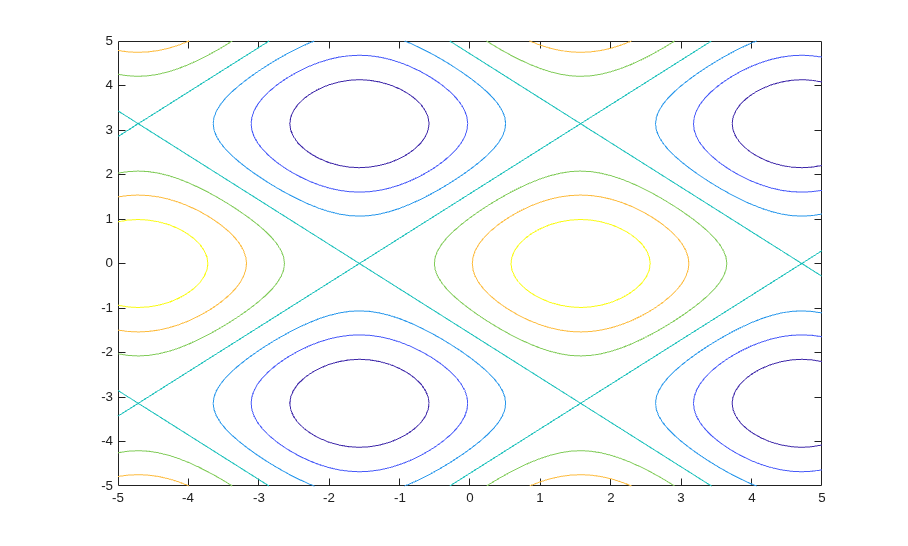
Plot . Add a title and axis labels. Create the x-axis ticks by spanning the x-axis limits at intervals of pi/2. Display these ticks by using the XTick property. Create x-axis labels by using arrayfun to apply texlabel to S. Display these labels by using the XTickLabel property. Repeat these steps for the y-axis.
To use LaTeX in plots, see latex.
syms x y
fcontour(x*sin(y)-y*cos(x), [-2*pi 2*pi])
grid on
title('xsin(y)-ycos(x) for -2\pi < x < 2\pi and -2\pi < y < 2\pi')
xlabel('x')
ylabel('y')
ax = gca;

S = sym(ax.XLim(1):pi/2:ax.XLim(2));
ax.XTick = double(S);
ax.XTickLabel = arrayfun(@texlabel,S,UniformOutput=false);

S = sym(ax.YLim(1):pi/2:ax.YLim(2));
ax.YTick = double(S);
ax.YTickLabel = arrayfun(@texlabel,S,UniformOutput=false);

Create animation of contours by changing the displayed expression using the Function property of the function handle, and then using drawnow to update the plot. To export to GIF, see imwrite.
By varying the variable  from
from  to
to  , animate the parametric curve
  .
.
syms x y
fc = fcontour(-pi/8.*sin(x)-pi/8.*cos(y));
for k = -pi/8:0.01:pi/8
    fc.Function = k.*sin(x)+k.*cos(y);
    drawnow
    pause(0.05)
end
Input Arguments
Name-Value Arguments
Specify optional pairs of arguments as
Name1=Value1,...,NameN=ValueN, where Name is
the argument name and Value is the corresponding value.
Name-value arguments must appear after other arguments, but the order of the
pairs does not matter.
Example: MeshDensity=30
The properties listed here are only a subset. For a complete list, see FunctionContour Properties.
For a custom color, specify an RGB triplet or a hexadecimal color code.
An RGB triplet is a three-element row vector whose elements specify the intensities of the red, green, and blue components of the color. The intensities must be in the range
[0,1], for example,[0.4 0.6 0.7].A hexadecimal color code is a string scalar or character vector that starts with a hash symbol (
#) followed by three or six hexadecimal digits, which can range from0toF. The values are not case sensitive. Therefore, the color codes"#FF8800","#ff8800","#F80", and"#f80"are equivalent.
Alternatively, you can specify some common colors by name. This table lists the named color options, the equivalent RGB triplets, and the hexadecimal color codes.
| Color Name | Short Name | RGB Triplet | Hexadecimal Color Code | Appearance |
|---|---|---|---|---|
"red" | "r" | [1 0 0] | "#FF0000" |
|
"green" | "g" | [0 1 0] | "#00FF00" |
|
"blue" | "b" | [0 0 1] | "#0000FF" |
|
"cyan"
| "c" | [0 1 1] | "#00FFFF" |
|
"magenta" | "m" | [1 0 1] | "#FF00FF" |
|
"yellow" | "y" | [1 1 0] | "#FFFF00" |
|
"black" | "k" | [0 0 0] | "#000000" |
|
"white" | "w" | [1 1 1] | "#FFFFFF" |
|
"none" | Not applicable | Not applicable | Not applicable | No color |








This table lists the default color palettes for plots in the light and dark themes.
| Palette | Palette Colors |
|---|---|
Before R2025a: Most plots use these colors by default. |
|
|
|


You can get the RGB triplets and hexadecimal color codes for these palettes using the orderedcolors and rgb2hex functions. For example, get the RGB triplets for the "gem" palette and convert them to hexadecimal color codes.
RGB = orderedcolors("gem");
H = rgb2hex(RGB);
Before R2024a: Get the hexadecimal color codes using
H = compose("#%02X%02X%02X",round(RGB*255)).
Before R2023b: Get the RGB triplets using RGB =
get(groot,"FactoryAxesColorOrder").
Line style, specified as one of the options listed in this table.
| Line Style | Description | Resulting Line |
|---|---|---|
"-" | Solid line |
|
"--" | Dashed line |
|
":" | Dotted line |
|
"-." | Dash-dotted line |
|
"none" | No line | No line |


Output Arguments
Algorithms
fcontour assigns the symbolic variables
in f to the x-axis, then the y-axis,
and symvar determines the order of the variables to be assigned. Therefore, variable
and axis names might not correspond. To force fcontour to assign
x or y to its corresponding axis, create the symbolic
function to plot, then pass the symbolic function to fcontour.
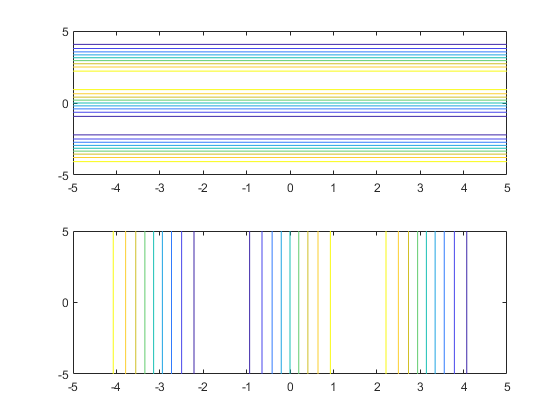
For example, the following code plots the contour of the surface f(x,y) = sin(y) in two ways. The first way forces the waves to oscillate with respect to the y-axis. In other words, the first plot assigns the y variable to the corresponding y-axis. The second plot assigns y to the x-axis because it is the first (and only) variable in the symbolic function.
syms x y;
f(x,y) = sin(y);

figure;
subplot(2,1,1)
fcontour(f);
subplot(2,1,2)
fcontour(f(x,y)); % Or fcontour(sin(y));
Version History
Introduced in R2016a

