show
Display plots for inspection of UAV logs
Syntax
Description
show(
generates all the plots stored in the flight log signal mapping object using the data from
an imported flight log. For a list of preconfigured signals and plots, see Predefined Signals and Predefined Plots. mapper,data)
show(___,PlotsToShow=plotNames) plots data using any of
the previous syntaxes with plot names specified as a string array. These plot names are
listed in mapper.AvailablePlots
plotStruct = show(___)
Input Arguments
Flight log signal mapping object, specified as a flightLogSignalMapping object.
Data from flight log, specified as a table, ulogreader
object, or other custom option. The data is fed directly into the plot functions
specified when you call updatePlot.
Initial time stamp for signal to extract, specified as a duration
object.
Final time stamp for signal to extract, specified as a duration
object.
Output Arguments
Figured of individual plots, returned as a structure of plot names and associated figure handles.
More About
The flightLogSignalMapping object has a set of predefined signals and plots. Use
info object
function to view the signals, and to check if a signal is already mapped and ready to
plot.
Signals with the format SignalName# support mapping multiple signals of the
same type. Replace # with incremental integer for each signal name of
that type.
Predefined Signals
| Signal Name | Description | Fields | Units |
|---|---|---|---|
Accel# | Raw accelerometer reading from IMU sensor | AccelX, AccelY, AccelZ | m/s^2, m/s^2, m/s^2 |
Airspeed# | Airspeed reading of pressure differential, indicated air speed, and temperature | PressDiff, IndicatedAirSpeed, Temperature | Pa, m/s, degreeC |
AttitudeEuler | Attitude of UAV in Euler (ZYX) form | Roll, Pitch, Yaw | rad, rad, rad |
AttitudeRate | Angular velocity along each body axis | BodyRotationRateX, BodyRotationRateY, BodyRotationRateZ | rad/s, rad/s, rad/s |
AttitudeTargetEuler | Target attitude of UAV in Euler (ZYX) form | TargetRoll, TargetPitch, TargetYaw | rad, rad, rad |
Barometer# | Barometer readings for absolute pressure, relative pressure, and temperature | PressAbs, PressAltitude, Temperature | Pa, m, degreeC |
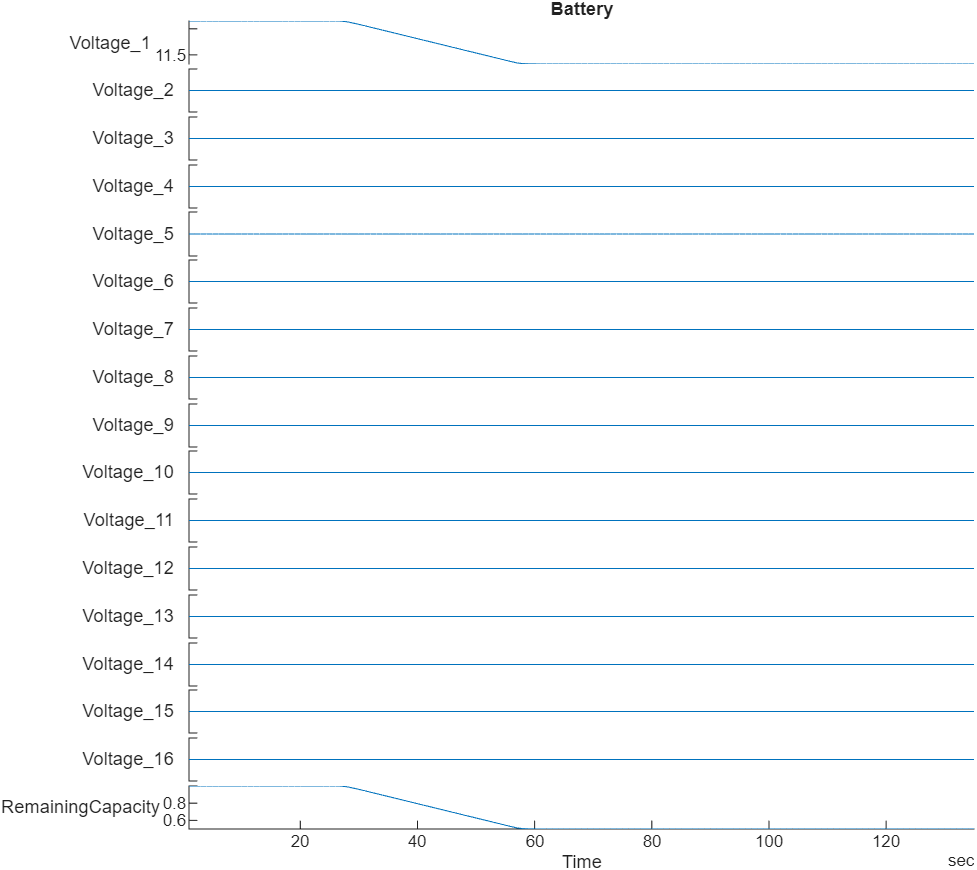
Battery | Voltage readings for battery and remaining battery capacity (%) | Voltage1,Voltage2, ... Voltage16, RemainingCapacity | v, v, ... v, % |
EstimatorInnovationAirspeed | Extended Kalman Filter (EKF) airspeed innovation and innovation variance | Airspeed, Var_Airspeed | m/s, (m/s)^2 |
EstimatorInnovationGPS | EKF GPS velocity and position innovations and innovation variances | V_X, V_Y, V_Z, P_X, P_Y, P_Z, Var_V_X, Var_V_Y, Var_V_Z,
Var_P_X, Var_P_Y, Var_P_Z | m/s, m/s, m/s, m, m, m, (m/s)^2, (m/s)^2, (m/s)^2, m^2, m^2,
m^2 |
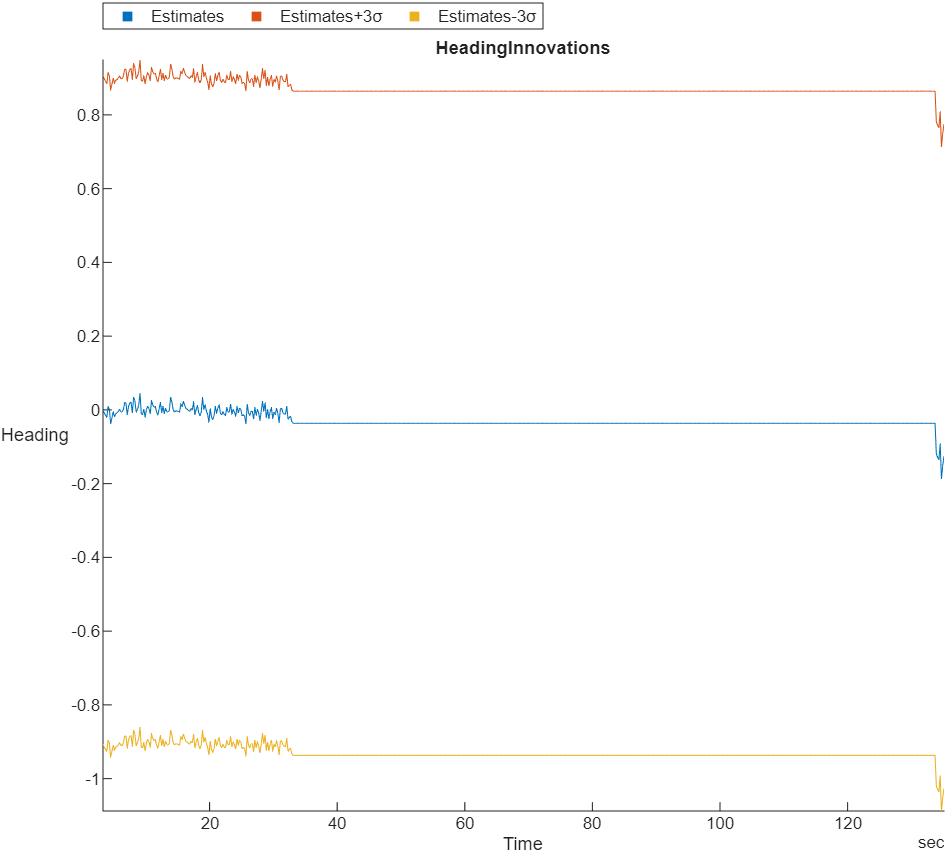
EstimatorInnovationHeading | EKF heading innovation and innovation variance | Heading, Var_Heading | rad, rad^2 |
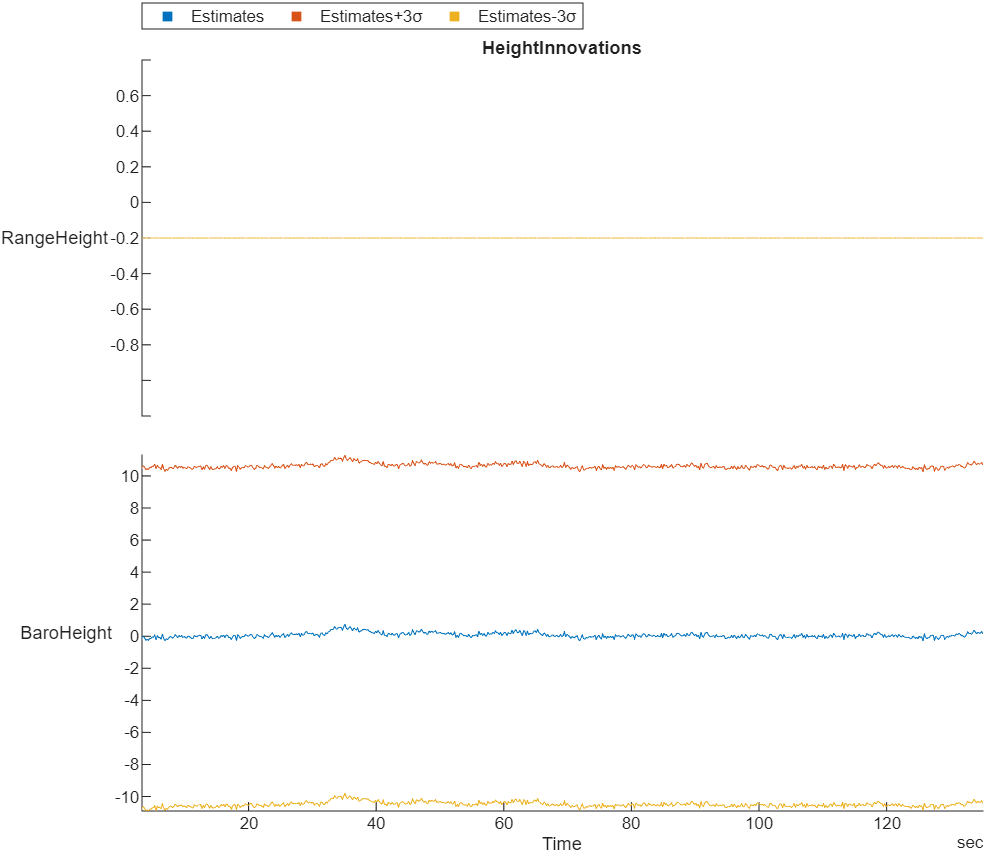
EstimatorInnovationHeight | EKF range sensor and barometer height innovations and innovation variances | RangeHeight, BaroHeight, Var_RangeHeight,
Var_BaroHeight | m, m^2, m^2 |
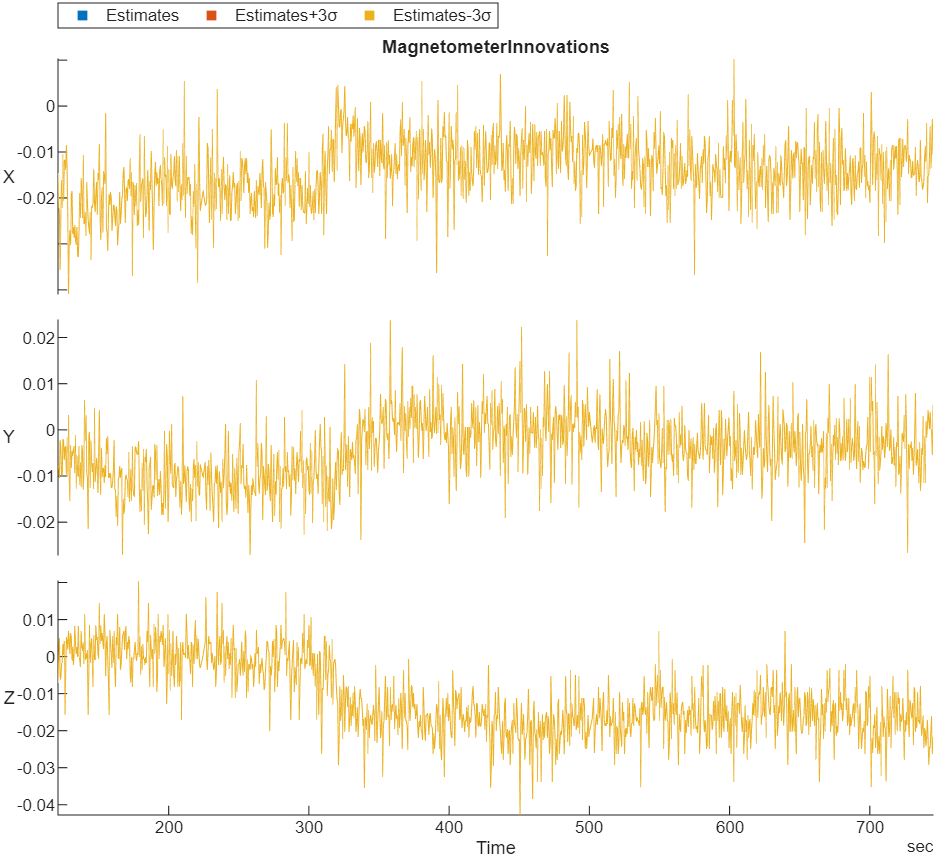
EstimatorInnovationMagnetometer | EKF magnetometer innovation and innovation variance | X, Y, Z, Var_X, Var_Y, Var_Z | Gauss, Gauss, Gauss, Gauss^2, Gauss^2, Gauss^2
|
EstimatorInnovationOpticalFlow | EKF optical flow sensor innovation and innovation variance | X, Y, Var_X, Var_Y | rad/sec, rad/sec, (rad/sec)^2, (rad/sec)^2 |
EstimatorStatesIMUBias | EKF inertial measurement unit (IMU) delta angle and velocity bias estimates and bias estimate variances | DeltaAngleBiasX, DeltaAngleBiasY, DeltaAngleBiasZ",
DeltaVelocityBiasX, DeltaVelocityBiasY, DeltaVelocityBiasZ,
Var_DeltaAngleBiasX, Var_DeltaAngleBiasY, Var_DeltaAngleBiasZ,
Var_DeltaVelocityBiasX, Var_DeltaVelocityBiasY,
Var_DeltaVelocityBiasZ | rad, rad, rad, m/s, m/s, m/s, rad^2, rad^2, rad^2, (m/s)^2,
(m/s)^2, (m/s)^2 |
EstimatorStatesMagnetometerBias | EKF Earth magnetic field and UAV body frame magnetic field bias estimates and bias estimate variances | EarthMagneticFieldN, EarthMagneticFieldE, EarthMagneticFieldD,
BodyMagneticFieldX, BodyMagneticFieldY, BodyMagneticFieldZ,
Var_EarthMagneticFieldN, Var_EarthMagneticFieldE,
Var_EarthMagneticFieldD, Var_BodyMagneticFieldX, Var_BodyMagneticFieldY,
Var_BodyMagneticFieldZ | gauss, gauss, gauss, gauss, gauss, gauss, gauss^2, gauss^2,
gauss^2, gauss^2, gauss^2, gauss^2 |
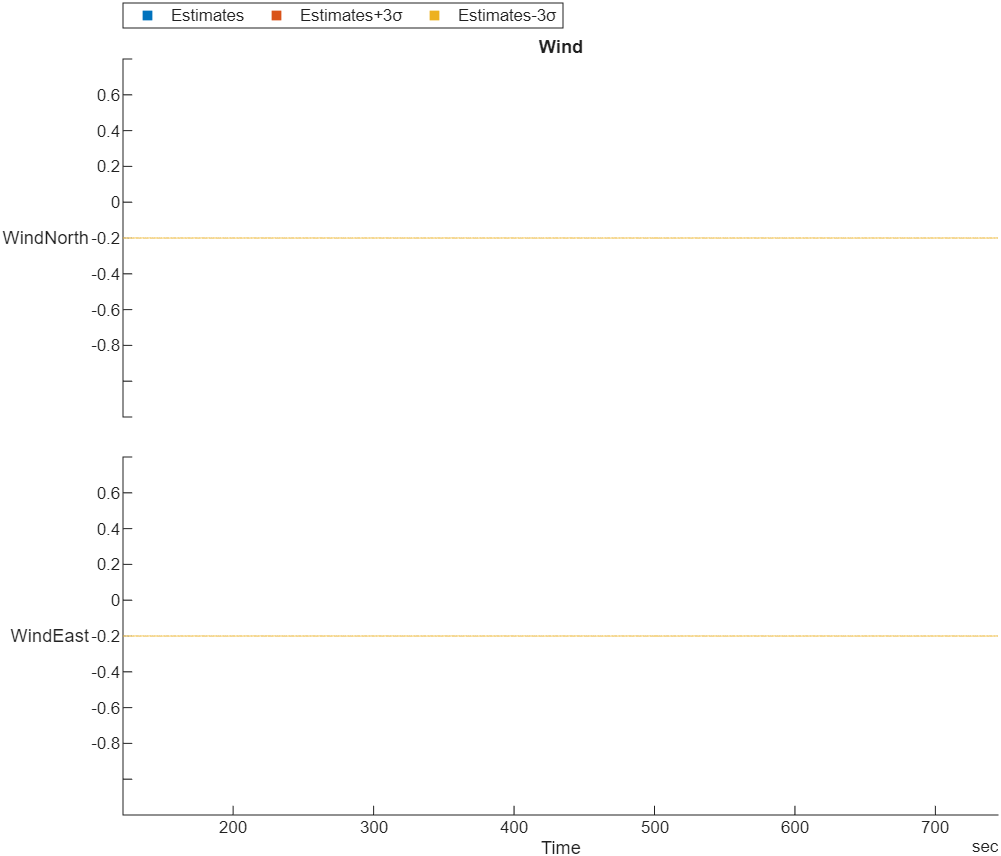
EstimatorStatesWind | EKF wind estimate and estimate variance | WindNorth, WindEast, Var_WindNorth,
Var_WindEast | m/s, m/s, (m/s)^2, (m/s)^2 |
EstimatorStatusControlMode | EKF logic states, specified as logical values | CS_TILT_ALIGN, CS_YAW_ALIGN, CS_GPS, CS_OPT_FLOW, CS_MAG_HDG,
CS_MAG_3D, CS_MAG_DEC, CS_IN_AIR, CS_WIND, CS_BARO_HGT, CS_RNG_HGT,
CS_GPS_HGT, CS_EV_POS, CS_EV_YAW, CS_EV_HGT, CS_BETA, CS_MAG_FIELD,
CS_FIXED_WING, CS_MAG_FAULT, CS_ASPD, CS_GND_EFFECT, CS_RNG_STUCK,
CS_GPS_YAW, CS_MAG_ALIGNED, CS_EV_VEL, CS_SYNTHETIC_MAG_Z,
CS_VEHICLE_AT_REST, CS_GPS_YAW_FAULT, CS_RNG_FAULT | None |
EstimatorStatusFlagAirspeed | Flag that indicates whether the EKF rejects the airspeed observation | RejectAirspeed | None |
EstimatorStatusFlagHeightAboveGround | Flag that indicates whether the EKF rejects the height above ground observation | RejectHeightAboveGround | None |
EstimatorStatusFlagHorizontalStates | Flags that indicate whether the EKF rejects the horizontal velocity and position observations | RejectVelocity, RejectPosition | None |
EstimatorStatusFlagMagnetometer | Flags that indicate whether the EKF rejects the magnetometer and yaw observations | RejectX, RejectY, RejectZ, RejectYaw | None |
EstimatorStatusFlagOpticalFlow | Flags that indicate whether the EKF rejects the optical flow observations | RejectX, RejectY | None |
EstimatorStatusFlagSideslip | Flag that indicates whether the EKF rejects the synthetic sideslip observation | RejectSyntheticSideslip | None |
EstimatorStatusFlagVerticalStates | Flags that indicate whether the EKF rejects the vertical velocity and position observations | RejectVelocity, RejectPosition | None |
EstimatorStatusFilterFault | Flags that indicate whether the EKF encounters faults such as numerical errors, bad data, or clipping | NUMERIC_ERROR_MAG_X, NUMERIC_ERROR_MAG_Y, NUMERIC_ERROR_MAG_Z,
NUMERIC_ERROR_MAG_HDG, NUMERIC_ERROR_MAG_DEC, NUMERIC_ERROR_ASPD,
NUMERIC_ERROR_SYNTHETIC_BETA, NUMERIC_ERROR_OPT_FLOW_X,
NUMERIC_ERROR_OPT_FLOW_Y, NUMERIC_ERROR_VEL_N, NUMERIC_ERROR_VEL_E,
NUMERIC_ERROR_VEL_D, NUMERIC_ERROR_POS_N, NUMERIC_ERROR_POS_E,
NUMERIC_ERROR_POS_D, NUMERIC_BAD_DELTA_VEL_BIAS,
NUMERIC_BAD_VERTICAL_ACCEL, NUMERIC_DELTA_VEL_CLIPPING | None |
EstimatorStatusGPSCheckFail | Flags that indicate the status of GPS checks | GPS_CHECK_FAIL_GPS_FIX, GPS_CHECK_FAIL_MIN_SAT_COUNT,
GPS_CHECK_FAIL_MAX_PDOP GPS_CHECK_FAIL_MAX_HORZ_ERR,
GPS_CHECK_FAIL_MAX_VERT_ERR, GPS_CHECK_FAIL_MAX_SPD_ERR,
GPS_CHECK_FAIL_MAX_HORZ_DRIFT, GPS_CHECK_FAIL_MAX_VERT_DRIFT,
GPS_CHECK_FAIL_MAX_HORZ_SPD_ERR, GPS_CHECK_FAIL_MAX_VERT_SPD_ERR,
GPS_CHECK_FAIL_SPOOFED | None |
EstimatorStatusTestRatio | Low-pass filtered ratio of the largest innovation to the innovation test limit | Heading, Velocity, Position, Height, TrueAirspeed,
HeightAboveGround, SyntheticSideslip | None |
GPS# | GPS readings for latitude, longitude, altitude, ground speed, course angle, and number of satellites visible | Latitude, Longitude, Altitude, GroundSpeed, CourseAngle,
SatellitesVisible | degree, degree, m, m/s, degree, N/A |
Gyro# | Raw body angular velocity readings from IMU sensor | GyroX, GyroY, GyroZ | rad/s, rad/s, rad/s |
LocalENU | Local ENU coordinates estimated by the UAV | X, Y, Z | m, m, m |
LocalENUTarget | Target location in local ENU coordinates | XTarget, YTarget, ZTarget | m, m, m |
LocalENUVel | Local ENU velocity estimated by the UAV | VX, VY, VZ | m/s, m/s, m/s |
LocalENUVelTarget | Target velocity in local ENU coordinates | VXTarget, VYTarget, VZTarget | m/s, m/s, m/s |
LocalNED | Local NED coordinates estimated by the UAV | X, Y, Z | m, m, m |
LocalNEDTarget | Target location in local NED coordinates | XTarget, YTarget, ZTarget | m, m, m |
LocalNEDVel | Local NED velocity estimated by the UAV | VX, VY, VZ | m/s, m/s, m/s |
LocalNEDVelTarget | Target velocity in local NED coordinates | VXTarget, VYTarget, VZTarget | m/s, m/s, m/s |
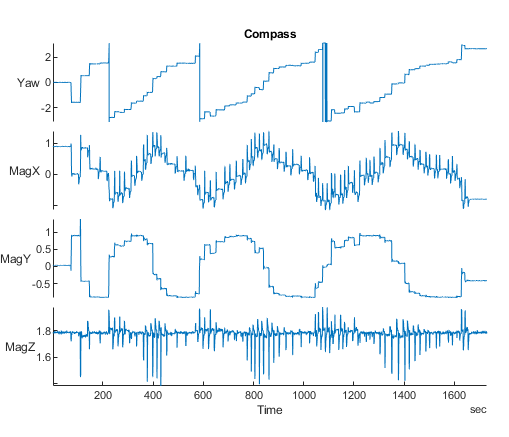
Mag# | Raw magnetometer reading from IMU sensor | MagX, MagY, MagZ | Gs, Gs, Gs |
After mapping signals to the list of predefined signals, you can use specific predefined plots
with the show object
function. To view a list of available plots and their associated signals for a
flightLogSignalMapping object, use the info object
function. If you want to define custom plots based on signals, use the updatePlot
object function.
Each predefined plot has a set of required signals that it must map.
Predefined Plots
| Plot | Description | Signals |
|---|---|---|
| Extended Kalman Filter (EKF) airspeed innovation and innovation variance | EstimatorInnovationAirspeed |
| Stacked plot of roll, pitch, and yaw angles and body rotation rates | AttitudeEuler, AttitudeRate, Gyro# |
| Estimated attitude of the UAV and the attitude target set point | AttitudeEuler, AttitudeTargetEuler |
| Stacked plot of battery voltage | Battery |
| Estimated yaw and magnetometer readings | AttitudeEuler, Mag#, GPS# |
| Stacked plot of the ratio of the largest EKF innovation to the innovation test limit | EstimatorStatusTestRatio |
| Raw Lat-Lon plot for GPS sensor readings | GPS# |
| Stacked plot of EKF GPS velocity and position innovations, and innovation variances | EstimatorInnovationGPS |
| Stacked plot of EKF heading innovation and innovation variance | EstimatorInnovationHeading |
| Stacked plots of barometer reading, GPS altitude reading, and fused height estimate | Barometer#, GPS#, LocalNED |
| Stacked plot of EKF range sensor and barometer height innovations and innovation variances | EstimatorInnovationHeight |
| Stacked plot of EKF inertial measurement unit (IMU) delta angle and velocity bias estimates and bias estimate variances | EstimatorStatesIMUBias |
| Stacked plot of EKF Earth magnetic field and UAV body frame magnetic field bias estimates and bias estimate variances | EstimatorStatesMagnetometerBias |
| Stacked plot of EKF Earth magnetic field and UAV body frame magnetic field bias estimates and bias estimates variancest | EstimatorInnovationMagnetometert |
| Stacked plot of ground velocity and air speed | GPS#, Airspeed# |
| Trajectory in local NED coordinates versus target set points | LocalNED, LocalNEDTarget |
| Error between desired and actual position in NED coordinates | LocalNED, LocalNEDTarget |
| Error between desired and actual velocity in NED coordinates | LocalNEDVel, LocalNEDVelTarget |
| Wind estimate and estimate variance | EstimatorStatesWind |
Version History
Introduced in R2020b
See Also
flightLogSignalMapping | mavlinktlog | extract | info | mapSignal | updatePlot
MATLAB Command
You clicked a link that corresponds to this MATLAB command:
Run the command by entering it in the MATLAB Command Window. Web browsers do not support MATLAB commands.
Select a Web Site
Choose a web site to get translated content where available and see local events and offers. Based on your location, we recommend that you select: .
You can also select a web site from the following list
How to Get Best Site Performance
Select the China site (in Chinese or English) for best site performance. Other MathWorks country sites are not optimized for visits from your location.
Americas
- América Latina (Español)
- Canada (English)
- United States (English)
Europe
- Belgium (English)
- Denmark (English)
- Deutschland (Deutsch)
- España (Español)
- Finland (English)
- France (Français)
- Ireland (English)
- Italia (Italiano)
- Luxembourg (English)
- Netherlands (English)
- Norway (English)
- Österreich (Deutsch)
- Portugal (English)
- Sweden (English)
- Switzerland
- United Kingdom (English)


