Select Signal to Analyze
The Wavelet Signal Analyzer app works with single-channel, real- and complex-valued 1-D signals in the MATLAB® workspace. The app supports single- and double-precision data. After you load a signal into the app, a nondecimated wavelet decomposition of the signal appears by default.
Load Signal
There are two different ways you can load a 1-D signal into the app.
If
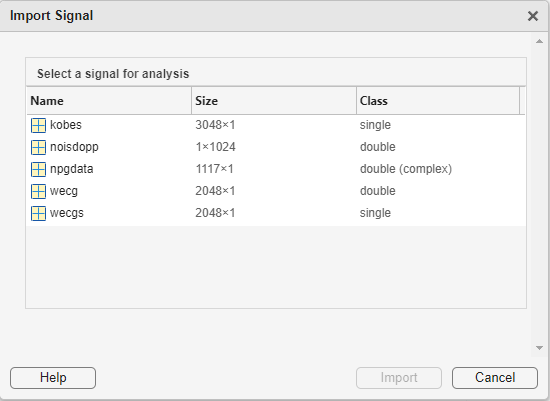
sigis a workspace variable, you can use the syntaxwaveletSignalAnalyzer(sig)at the command prompt to open Wavelet Signal Analyzer and obtain the default decomposition ofsig.You can use the Import Signal dialog box to browse all the variables in the workspace that the app can process, and choose the desired signal.
Open Wavelet Signal Analyzer.
Open the dialog box by clicking Import on the Analyzer tab.
Select the signal and click Import in the dialog box to obtain the default decomposition.

Once you import the signal, the app displays the decomposition in the Scenarios pane. It derives the decomposition name by default from the workspace variable.
Navigate Main Display
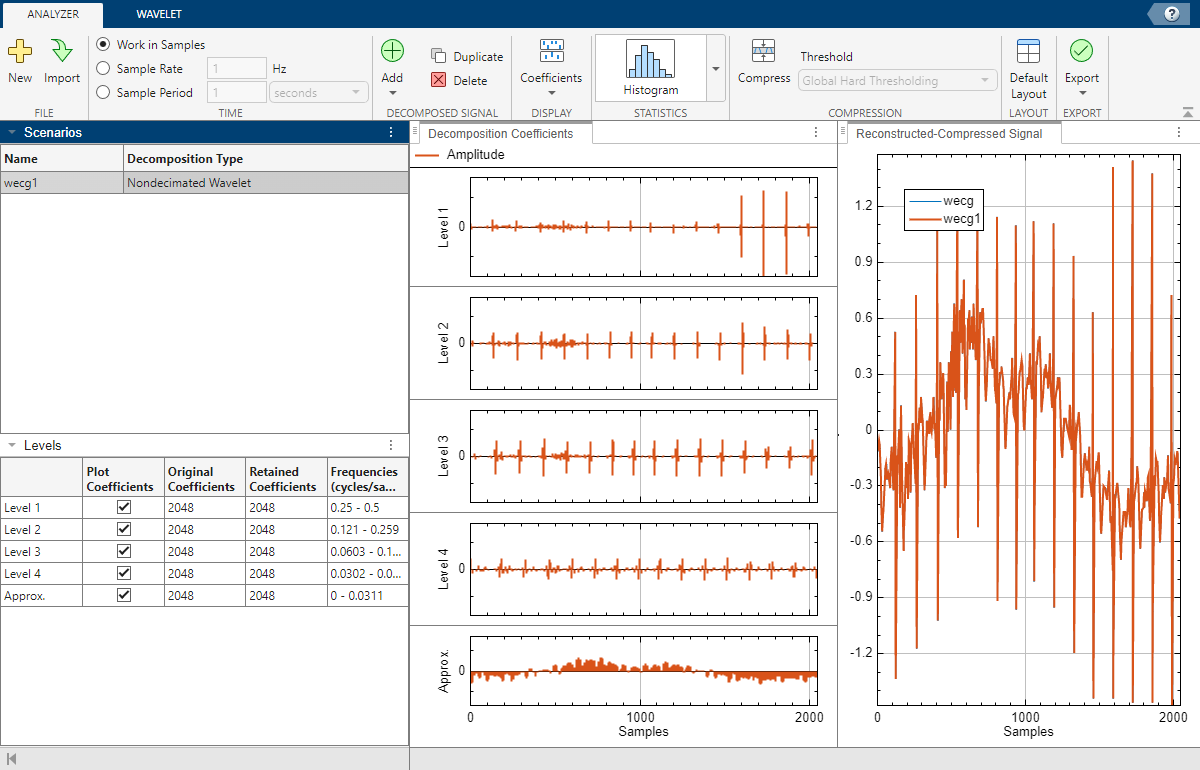
Using the Analyzer tab, you analyze and interact with the wavelet decomposition. For example, you can change how to display the coefficients, as well as generate and plot statistics of the decomposition. You can also compress the signal.
Tab Sections
File — Click the New button to clear all scenarios (decompositions) from the current session. In the Clear Current Session dialog box, click OK to confirm. Otherwise, click Cancel. To import a signal into the app, click Import. In the Import Signal dialog box, select the signal and click Import. Otherwise, click Cancel. You can import a signal at any time.
Time — Use this tab to change how to specify time. Frequencies units in the table in the Levels pane depend on how you specify time.
Decomposed Signal — To duplicate the selected scenario, click Duplicate. When you duplicate a scenario, the app preserves all wavelet parameters associated with the original scenario. To remove a scenario, click Delete. To obtain a different type of wavelet decomposition, click Add, and select the decomposition type. The app displays the decomposition using default parameters. For more information, including a list of supported decompositions, see the next step in the workflow, Decompose Signal.
Display — By default, the app displays the amplitudes of the coefficients of the scenario that you have selected in the Decomposition Coefficients pane. To display the magnitudes or sorted magnitudes, click Coefficients and select the appropriate option. For wavelet packet decompositions, additional options are available. For more information, see Visualizing Wavelet Packet Terminal Nodes in Wavelet Signal Analyzer. If you are performing signal compression, you can also choose to display the thresholded coefficients.
Statistics — Click the arrow to open the gallery, and choose the statistics to plot for the selected scenario. For more information, see Explore Signal Decomposition.
Compression — To enable compression, click Compress and select a thresholding method. For more information, see Compress Signal.
Export — To export results to the workspace, or generate a script to reproduce results, choose the appropriate item from the Export drop-down list. For more information, see Share Results.

Panes and Figures
The default view of Wavelet Signal Analyzer has these panes and figures.
Scenarios — List of all the decompositions (scenarios) in the current session. To rename or delete a scenario, right-click its name and select an option.
Levels — For discrete wavelet transforms, the app displays the number of coefficients (Original Coefficients), the number of nonzero coefficients (Retained Coefficients), and the approximate frequency band in the Levels pane. The frequency units depend on how you specify time. To plot the coefficients at a specific level, select the check box. To hide the coefficients at a specific level, clear the check box. For discrete wavelet packet transforms, the table shows the same information for a subset of the terminal nodes of the decomposition. For more information, see Decompose Signal.
Note
When you compress a signal, the app updates the values in the Retained Coefficients column. For more information, see Compress Signal
Decomposition Coefficients — This pane contains the plots of the coefficients at the scales or terminal nodes listed in Levels. Under Coefficients on the Analyzer tab, select one of these options:
Amplitude
Magnitude
Sorted magnitude
If you have enabled compression, you can choose to view the thresholded coefficients in addition to the decomposition coefficients in the same format.
Reconstructed-Compressed Signal — This pane contains plots of the original signal and the reconstruction. By default, the two plots are identical. If you enable compression, the app also plots the compressed signal. The plot legend is interactive. To hide a plot, click its name in the legend.
Note
For wavelet packet transforms, Levels lists at most 32 terminal nodes. The app orders the nodes by relative energy in descending order, plots the coefficients of only the nodes in the list, and in the same order. For more information, see Visualizing Wavelet Packet Terminal Nodes in Wavelet Signal Analyzer.
For complex-valued signals, all plots show the real and imaginary parts separately. For more information, see Wavelet Decomposition of Complex-Valued Signal Using Wavelet Signal Analyzer.

Workflow
| Current Step | Next Step |
|---|---|
| Select Signal to Analyze | Decompose Signal |