How to Make Subplots in MATLAB using Tiledlayout
Learn how to use tiledlayout to create subplots in MATLAB.
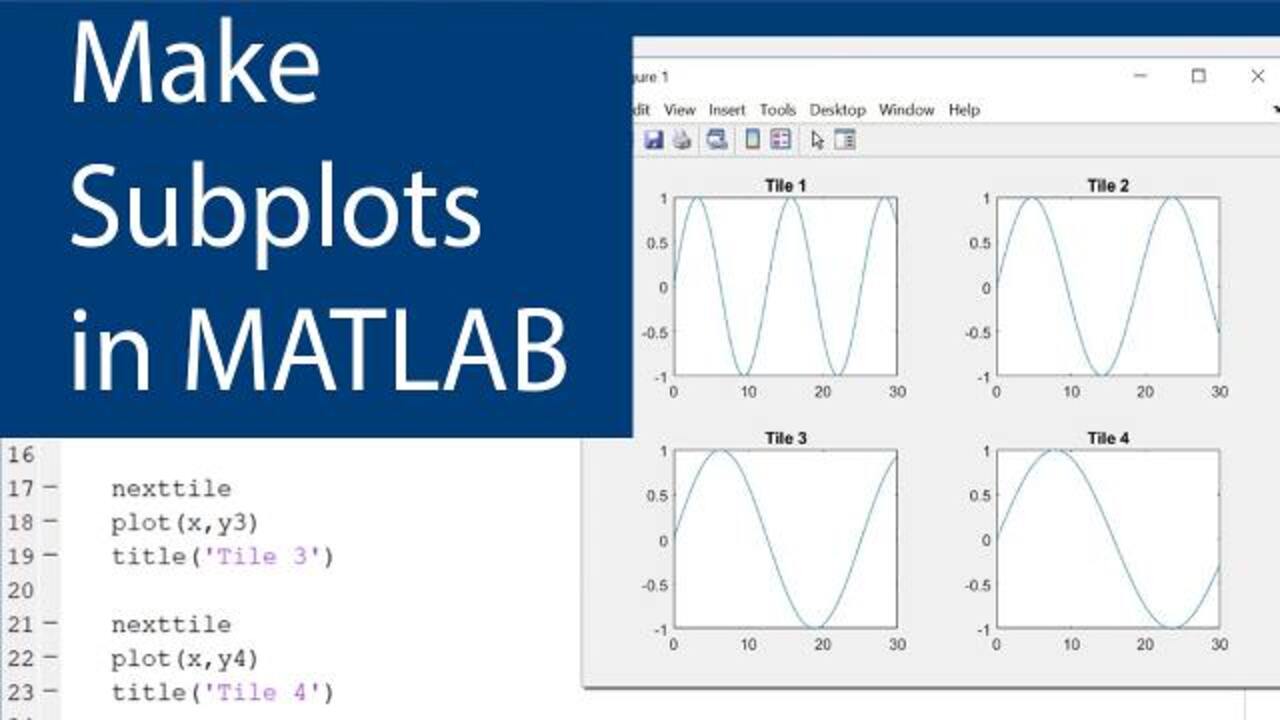
tiledlayout creates a tiled chart layout for displaying multiple plots in the current figure. The layout has a fixed m-by-n tile arrangement that can display up to m*n plots. If there is no figure, MATLAB® creates a figure and places the layout into it. If the current figure contains an existing layout, MATLAB replaces that layout with a new one.
tiledlayout('flow') specifies the 'flow' tile arrangement for the layout. Initially, there is only one empty tile that fills the entire layout. As you call nexttile, the layout reflows as needed to accommodate the new axes while maintaining an aspect ratio of roughly 4:3 for all the tiles.
Published: 4 Sep 2020
Select a Web Site
Choose a web site to get translated content where available and see local events and offers. Based on your location, we recommend that you select: United States.
You can also select a web site from the following list
Americas
- América Latina (Español)
- Canada (English)
- United States (English)
Europe
- Belgium (English)
- Denmark (English)
- Deutschland (Deutsch)
- España (Español)
- Finland (English)
- France (Français)
- Ireland (English)
- Italia (Italiano)
- Luxembourg (English)
- Netherlands (English)
- Norway (English)
- Österreich (Deutsch)
- Portugal (English)
- Sweden (English)
- Switzerland
- United Kingdom (English)