Improving Quant Portfolios with the MarketPsych ESG Controversies and MATLAB
Richard Peterson, MarketPsych
Identifying companies’ trends in ESG controversies can provide valuable insight for mitigating risk in equity and fixed income portfolios. Refinitiv MarketPsych ESG Analytics data, via Refinitiv, provides sentiment scores distilling a massive collection of news and social media content through an extensively curated language framework. Richard Peterson, CEO of MarketPsych, introduces the data set, and Valerio Sperandeo of MathWorks shows how to quickly build a quantitative investment strategy using the data in MATLAB®.
Published: 3 Feb 2023
Good to chat with everyone. I think the meat of this show today will actually be Valerio. So I will give it introduction to the data set that Valerio is working with, with MATLAB. And then he'll talk about some of the research that he's done, which I think will be very interesting for you.
So we are looking at a data set that is based on unstructured data. So we're using natural language processing. We're converting news and social media into ESG scores. So depending on if a company's referred to-- related to there are human rights violations or workplace controversies or scandals, those are converted into scores that represent the percentage of all conversations that are about that topic.
And the reason we create this, based on the media-- so over here on the right side is what's called media ESG sentiment data. And that's what we're going to be doing today is talking about. On the left side is traditional ESG data. So most ESG data is actually based on company reporting, corporate filings, press releases about the companies, and their activities.
Our ESG data that we'll be looking at today is based on the third party media, social media, news media, and what people are saying about a company. In this data set, we exclude press releases. We exclude anything that is from the perspective of the company itself or the corporate officers. So we're trying to get the objective view of the company so that we can understand specifically what's happening on a negative basis with that company.
So companies tend not to report negative ESG activities. They report positive ESG activities. But if there is a management scandal or sexual harassment, for example, that is more likely to be reported in social media than by the company. The company only later reports it, and they talk about what they're doing to fix it. So that's why we look at controversy specifically from the media.
Now, in this particular feed, it's called the Refinitiv MarketPsych ESG Analytics. This is the feed that Valerio we'll be working with today. And it covers over 100,000 companies. It goes back to 1998, and as point in time and the way that it includes companies since 1998.
It's multiple languages, 13 languages, and covers over 100 controversies and topics in the advanced feed. It's also real time. So it comes out every 60 seconds with an update based on all of the media in the last couple of minutes, hourly and then daily. So if there is an ESG scandal breaking, sometimes it can be very quick about that and see it before many others in the market do.
We have news and social media feeds. We publish them separately, but we also have a third feed where they're combined together. And I believe that's what Valerio was working with today is the combined news and social feed. And it is mapped to common ESG frameworks as well and inspired by those.
So it gives an external and a fast perspective. Now we create this media data based on a pool of 300,000 sources, though we've narrowed those down to about 6,000 that are objective and useful sources. So there are a lot of sources maybe that aren't that influential or aren't objective in the ESG space.
We try to look for those that have multiple perspectives about a given topic. And from regions or countries where if someone gives two sides of an issue, they won't get in trouble. So obviously, you can-- in some regions, if you give alternative perspectives, you are banned as an investigative journalist.
We have, again, over 100,000 companies. And then we have, in this example, Luckin Coffee is coming from a given headline. So we processed 2 million articles a day, and we pull out 4,000 meanings. These meanings are essentially the puzzle pieces of ESG. So if we're given this headline from CNBC that China's Luckin Coffee is plummeting after a CEO investigation, we can say, oh, there's a management investigation at the company.
So that is one of those 4,000 puzzle pieces. But because that's 4,000 is too many to work with as a quant, it's too easy to overfit, what we do is aggregate those together into general ESG themes and controversies. And these are inspired by the Refinitiv ESG Framework, which is one of the standard traditional data sets. And it covers about 400. We found that we could map about 250 of their traditional scores to natural language processing. And then we added some additional scores that we could capture through natural language processing that are usually not captured by a human analyst.
So here's an example of how that would appear if we were to aggregate together, say, all of the ESG controversies about a given company. So the black line here is the Luckin Coffee share price in early 2020. And the blue line here is the ESG controversy score. Now a low controversy score is a bad thing in this case.
And what we are tracking with our ESG controversy score is just all the negative commentary. Now in Luckin Coffee, it happened to be governance commentary. Muddy Waters short selling research firm put out a negative report and said that they were selling the shares because they thought there was some sales numbers being fudged at Luckin Coffee.
Now you can see the black line. The share price had a lot of volatility here. This was due to the COVID lockdowns in China, the big sell-off. And then it rebounded after Muddy Waters report because the Chinese New Year had ended, and people were able to get their coffee from Luckin Coffee again. And then it sold off again with the global market sell-off and then collapsed when the company admitted wrongdoing.
So what's interesting here is there's a suggestion that maybe news media-based controversies and social media controversies might occur and impact scores before the share prices is impacted substantially. So that's the question. There are, as we know, a lot of slower moving players in the ESG space-- pension funds and big ETFs-- that aren't trading every day based on the information they get. So if you are trading within an hour of a scandal breaking, that might give you quite an advantage as an investor in the markets.
And so we'll investigate that in a minute, but here are some of the scores that we're able to produce. It's not just this general ESG controversy score, but there's a lot of other details here. You can see under the green bars the environmental scores, governance scores under the yellow. And then under the purple, we have social. And there's a lot more social that map to, of course, news and social media than some of these others.
However, we can do things like look at, does a company have climate policy according to the media? Or are their airborne emissions improving or worsening? And then specifically, because companies are always talking about their improvements, we can look at just general negative news like controversies, like airborne emissions controversy, or carbon emissions controversy to below that. So the controversies are really what Valerio will be looking at.
And you can see how the data is created here as a percentage of all the references. So I won't spend a lot of time on this example here because it's a bit noisy. But under the management trust column in the blue dotted lines, you can see that for Luckin Coffee, which is every row here is their 24-hour period, the management trust will say negative 12%. All the positive minus, all the negative references to Luckin Coffee about-- or at least positive about the management trust and preferences the management minus the mistrustful, given negative 12% score there for Luckin Coffee.
And then we also see litigation scores here. For litigation, it is a unipolar score where any reference to litigation is generally a negative thing. So it's a controversy. And about 10% of all the references to Luckin Coffee contained references to litigation like class action lawsuits. So there are a lot of people upset with Luckin Coffee talking about suing the company around the time that the company itself releases its bad news.
Now, when we plot this type of data-- this is Wirecard, another famous accounting controversy-- you can see that, over time, there are often rumors or hints of controversies before the big controversy breaks. And this is something that Valerio will be showing as well in a few minutes. So when the Financial Times doubted the accounting practices of Wirecard, we see here they published an article. It hit the share price a bit, but the share price then recovered.
Meanwhile, more and more people started rumoring and talking about this that KPMGs, that they couldn't issue an audit opinion. And then the company itself said it was missing 1.9 billion euros, and the share price collapsed. But over time, you see the evolution of these rumors as more and more people investigate until finally, in this case, the company admits it.
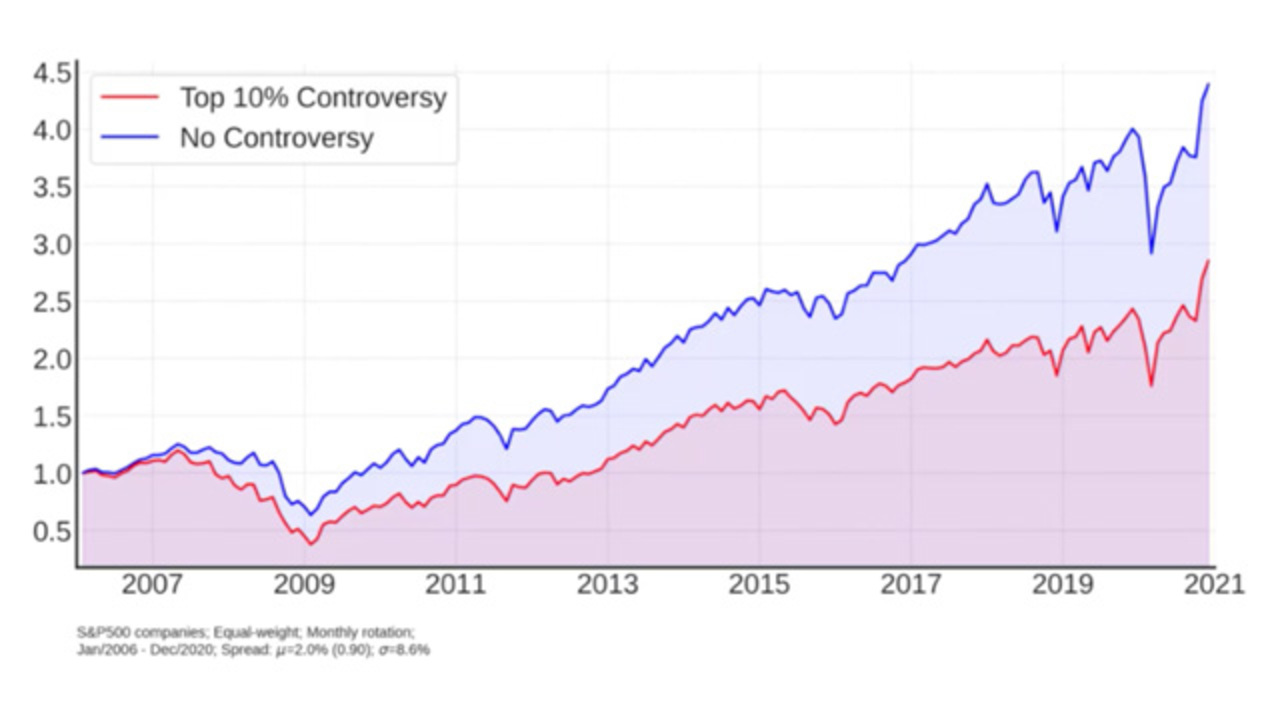
And when we look at this in a quantitative study, just looking at the absolute level of a score we produce called accounting controversy. So we've both looked Luckin and Coffee and now Wirecard. But what if we look at hundreds of companies? In this case, we looked at the S&P 500.
Since 2006, each month, the companies and the top 10% of their accounting controversy score, meaning the highest references as a percentage of all the ESG references to them were about dubious accounting practices or unclear accounting doubts about their accounting. If we create a monthly portfolio-- this is a monthly rotation model with those companies-- we find that those with the highest controversy, the top 10% in the red line here, significantly underperform the S&P 500. And there's a nice gradual spread here.
So this tells us that there's probably some advantage to avoiding companies, even in a very slow moving monthly rotation model, any companies that are having accounting controversies. They tend to get penalized by the market going forward.
And just as a general look, when we aggregate all of these types of controversies together, we see that in this case, all the ESG controversies-- now, the prior example for accounting was a very specific type of controversy. But what if we aggregate all ESG types of controversies together?
There we see that ESG controversies really started-- as a broad theme, started penalizing companies throughout 2014, which is around the time of the oil price collapse in 2014, 2015. And we see here that positive companies on the green line, those with low controversies, have generally been outperforming on a monthly rotation model. This is based on the Russell 3,000.
And then lastly, we also see with those controversial companies, they have much higher volatility. So in the red line here, companies with ESG controversies, even though they didn't outperform in the early years of the last couple of decades, they did have higher volatility. So that tells us that they could improve a portfolio, regardless, just by avoiding companies with high ESG controversies over time.
And as you saw, ESG controversies include a lot of traditional controversies like accounting and controversies, which are not always considered ESG. But ESG includes governance. And if there's poor accounting, of course, that is a flawed governance.
We have seen how Richard has demonstrated us the portfolio rotation model and its results at an aggregate level, looking at the aggregate ESG controversy score. The one exercise that we have run in MATLAB is looking at the momentum of ESG controversies individually. We are going to explore what is the impact of decreasing or increasing ESG controversies on equities.
This is a strategy that starts becoming quite common in the industry. The particular aspect here is that we look at the controversy momentum factor. And what is intended by that is, in particular, that we are going to build two portfolios. One is made of ESG so-called ESG decliners. We call those companies that have increasing controversies.
This may sound-- it may sound counterintuitive if we say that these are falling in the top quintile of the ESG controversy momentum distribution. But actually, it makes sense because a company that has a higher ESG controversy score, it's a company that has more controversies that are published either in the social media or in the professional new. And having more controversies may negatively impact its return.
The second portfolio is made of so-called ESG improvers. These are conversely companies with decreasing the controversies. And they are falling in the bottom quintile of the ESG controversy momentum distribution. The interpretation of these two portfolios or the interpretation of such a strategy may be depending on the reputational damage of companies that are affected by an increasing trend in the ESG controversies and therefore being affected by a short or longer term investment outflow.
On the other hand, companies that are decreasing their controversies may benefit from, for example, an active engagement process that is undergoing by some of their institutional investors. And as a positive result of such a process, gain higher allocation in the investors' portfolios.
I'm briefly going through the creation of such a factor. It's relatively simple. The first step consists in the so-called mass weighting scheme. We are converting the daily ESG controversy scores into monthly ones. And we do that by applying a weighted average.
The weights are nothing but the so-called daily bars, which is the amount of media references for that specific company and for that particular day. So in short, this is simply the number of times that the company is mentioned in some chatter in the social media or in professional news.
But the buzz-weighting scheme is supposed to help us smooth out some of the noise that we may encounter. We are still applying a moving average of the monthly series of scores in order to still overcome some of the changes that you have in this course and therefore provide for more-- for a higher stability in the portfolio rotation.
Third step, we compute the momentum factor of the monthly ESG scores. The momentum is simply-- just like in the price momentum case is simply the positive or negative change of the company's ESG scores over a certain period. In our exercise, I'm going to show you we have been using a two-month period.
And ultimately, the last step, we compute the quintiles of the factor distribution. So we are able to identify the ESG improvers with those companies falling in the bottom quintile and the ESG decliners with the companies falling in the top quintile.
As I introduced before, we have been looking at ESG topics individually. So the results I'm going to show you at the end of the presentation are really for the single ESG topics that market cycles kindly provided us. We still get categories or topics in all three environmental, social, and corporate governance categories.
You'll see some here. Now the choice over the controversies, topics is really arbitrary. We have simply taken all those scores with a label containing the term controversy. But obviously, the same analysis can be applied to all the others. Among the emissions, environmental and resource use, you see that we have been testing portfolio against carbon emissions, pollution, airborne emissions, sustainability, resource use, topics.
Moving on with the social category, here we have been testing corruption, crime, ethics, IP, public health controversies falling into the community category but also some others falling into the human rights, product, workforce categories. Last but not least, corporate governance-- here we have been looking at controversies related to management, accounting credit, insider dealing, shareholder rights, tax fraud, and securities.
Let's have a quick look now how these actually look like in MATLAB and how you can make this an ESG strategy. This is based on something that we have recently introduced. It's the so-called backtesting framework, and it's made of four steps.
The first one implies creating a backtest strategy object. This is really going to contain-- it's an object that contains the strategy logic. This has the flexibility of being coded as a function at all.
So as you are probably already familiar with developing MATLAB functions, that's all you need to know. You write your code in MATLAB, your function that does the rebalancing for you. And you pass it directly to the vector strategy object.
Other inputs can be passed at this stage. Obviously, you may want to customize the frequency of your portfolio rotation. You want to calibrate your model or your window on different time spans and so on. This is all that can be done at this stage.
Moving on, the second step consists of creating a backtestEngine object. Here, additional inputs can be passed to the backtesting exercise. Some of those that you are not-- that are not listed here, but you can easily find them in our documentation or the definition of a risk-free rate, of a cash flow rate, here you see an initial portfolio value.
But really, the important step is passing to the backtestEngine one or more strategy objects that you have created in the previous step. And here we do it for the two strategies that we have just been talking about. The good part is that, as we will see later on, we are able to simultaneously backtest more strategy all at once, And. Is obviously reducing the amount of code and the details that are implied by including more strategies.
The third step, we are actually executing the backtesting by using the function runBacktest. This is the step when we are passing to the function, not only the backtestEngine that we have just created, but, obviously, the prices of all companies in your universe, as well as the ESG course. In our case, the momentum ESG's controversy scores.
Once your backtest-- run backtest function has completed, you can then analyze the results, the final results, with the two methods summary and equity curve. What are these producing is a nice display of the equity curves for each of the strategies you have been including in your backtesting exercise, as well as a nice table which includes summary statistics such as the total return, the Sharpe ratio, the turnover, max drawdown, or trading costs if you have been including any in your backtesting.
Let's have a look at our results, the results we got from the exercise we run. So we have used among monthly portfolio rotation equal weight allocation on companies in the S&P 500. And the backtest has been performed for the time frame that goes from April 2012 till December 2021.
And as you can see from the bar chart, most of the ESG improvers portfolios have outperformed ESG decliners. These for 22 controversy teams out of the 32 we have been testing. And you see that the biggest performers are credit management, community, and product improvers. And really, only for one ESG topic, emission controversies, we have seen a consistent annualized negative excess return. So that was really an interesting result.
For further information, just visit our documentation here. Also, if you will have the chance to look through the presentation, links to our documentation with examples and functionalities that have been used for performing this exercise. And with that, I think I'm heading back to recharge for the conclusions.
Great. Thanks. Thanks to Valerio. That was very interesting. So as you can see in this research, there may be value, both in understanding ESG controversies, as well as the momentum so the change in direction of where they're going.
So there's a lot of ways of looking at ESG, obviously. And we'd love to hear your questions if there's anything you have in mind or thoughts about this type of data. I know that ESG is quite data is often not been appealing to quants because most of the traditional data sets are backfilled and reviewed by human analysts and things like that make them much more unreliable.
Featured Product
MATLAB
Up Next:

Related Videos:


Select a Web Site
Choose a web site to get translated content where available and see local events and offers. Based on your location, we recommend that you select: United States.
You can also select a web site from the following list
Americas
- América Latina (Español)
- Canada (English)
- United States (English)
Europe
- Belgium (English)
- Denmark (English)
- Deutschland (Deutsch)
- España (Español)
- Finland (English)
- France (Français)
- Ireland (English)
- Italia (Italiano)
- Luxembourg (English)
- Netherlands (English)
- Norway (English)
- Österreich (Deutsch)
- Portugal (English)
- Sweden (English)
- Switzerland
- United Kingdom (English)