mapcaplot
Create Principal Component Analysis (PCA) plot of microarray data
Description
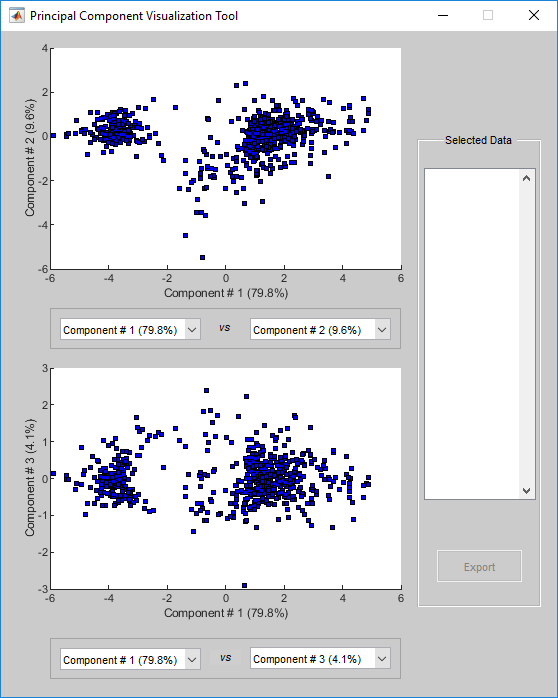
mapcaplot( creates 2-D scatter plots of
principal components of data)data. Once you plot the principal components,
you can:
Select principal components for the x and y axes from the drop-down list below each scatter plot.
Click a data point to display its label.
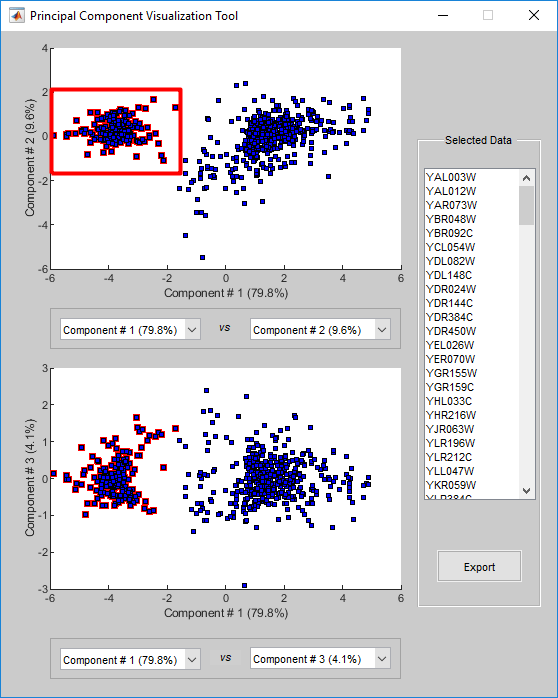
Select a subset of data points by dragging a box around them. Points in the selected region and the corresponding points in the other axes are then highlighted. The labels of the selected data points appear in the list box.
Select a label in the list box to highlight the corresponding data point in the plot. Press and hold Ctrl or Shift to select multiple data points.
Export the gene labels and indices to the MATLAB® workspace.
Examples
Create a PCA plot to visualize genes involved during the metabolic shift from fermentation to respiration of yeast (Saccharomyces cerevisiae).
Load the data file that contains filtered yeast microarray data. The data comes from an experiment (DeRisi et al., 1997) that used DNA microarrays to study temporal gene expression of these genes. Expression levels were measured at seven time points during the diauxic shift.
load filteredyeastdataThis MAT-file includes three variables:
yeastvalues — A matrix of gene expression data from Saccharomyces cerevisiae (yeast) during the metabolic shift from fermentation to respiration
genes — A cell array of GenBank® accession numbers for labeling the rows in yeastvalues
times — A vector of time values for labeling the columns in yeastvalues
Perform PCA on the expression data and plot the result.
mapcaplot(yeastvalues, genes)
Select a subset of data points by dragging a box around them. The data points are highlighted and their corresponding labels appear in Selected Data. You can then export the selected data to the workspace by selecting Export.
Input Arguments
References
[1] DeRisi, J.L., Iyer, V.R., and Brown, P.O. (1997). Exploring the metabolic and genetic control of gene expression on a genomic scale. Science 278, 680–686s.
Version History
Introduced before R2006a
See Also
clustergram | mattest | mavolcanoplot | pca