plotDetection
Display object detections on bird's-eye plot
Syntax
Description
plotDetection(
displays object detections from a list of object positions on a bird's-eye plot.
The detection plotter, detPlotter,positions)detPlotter, is associated with a
birdsEyePlot object and
configures the display of the specified detections.
To remove all detections associated with detection plotter
detPlotter, call the clearData function and specify detPlotter
as the input argument.
plotDetection(
displays detections and their velocities on a bird's-eye plot.detPlotter,positions,velocities)
plotDetection(
displays detections and their labels on a bird's-eye plot.detPlotter,positions,labels)
plotDetection(
displays detections and their velocities and labels on a bird's-eye plot.
detPlotter,positions,velocities,labels)velocities and labels can appear
in either order but must come after detPlotter and
positions.
Examples
Create a bird's-eye plot with an x-axis range from 0 to 90 meters and a y-axis range from –35 to 35 meters.
bep = birdsEyePlot('XLim',[0 90],'YLim',[-35 35]);

Display a coverage area with a 35-degree field of view and a 60-meter range.
caPlotter = coverageAreaPlotter(bep,'DisplayName','Radar coverage area');
mountPosition = [1 0];
range = 60;
orientation = 0;
fieldOfView = 35;
plotCoverageArea(caPlotter,mountPosition,range,orientation,fieldOfView);

Display radar detections with coordinates at (30, –5), (50, –10), and (40, 7).
radarPlotter = detectionPlotter(bep,'DisplayName','Radar detections');
plotDetection(radarPlotter,[30 -5; 50 -10; 40 7]);

Create a bird's-eye plot with an x-axis range from 0 to 90 meters and a y-axis range from –35 to 35 meters. Create a radar detection plotter that displays detections in blue.
bep = birdsEyePlot('XLim',[0 90],'YLim',[-35 35]);
detPlotter = detectionPlotter(bep,'DisplayName','Radar detections', ...
    'MarkerFaceColor','b');

Display the positions and velocities of three labeled detections.
positions = [30 5; 30 -10; 30 15];
velocities = [-10 0; -10 3; -10 -4];
labels = {'D1','D2','D3'};
plotDetection(detPlotter,positions,velocities,labels);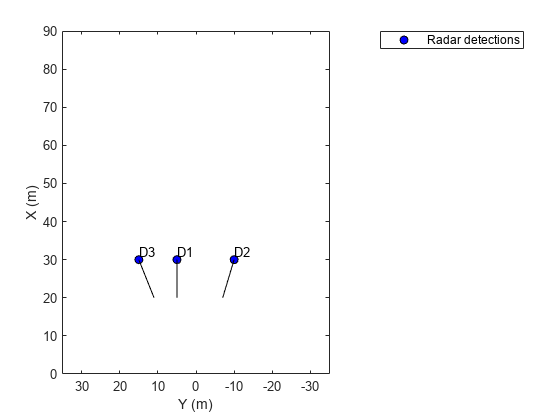
Input Arguments
Detection plotter, specified as a DetectionPlotter
object. This object is stored in the Plotters property
of a birdsEyePlot object and
configures the display of the specified detections in the bird's-eye plot.
To create this object, use the detectionPlotter
function.
Positions of detected objects in vehicle coordinates, specified as an M-by-2 real-valued matrix of (X, Y) positions. M is the number of detected objects. The positive X-direction points ahead of the center of the vehicle. The positive Y-direction points to the left of the origin of the vehicle, which is the center of the rear axle, as shown in this figure of the vehicle coordinate system.

Velocities of detected objects, specified as an M-by-2 real-valued matrix of velocities in the (X, Y) direction. M is the number of detected objects. The velocities are plotted as line vectors that originate from the center positions of the detections as they are tracked.
Detection labels, specified as an M-length string array
or M-length cell array of character vectors.
M is the number of detected objects. The labels
correspond to the locations in the positions matrix. By
default, detections do not have labels. To remove all annotations and labels
associated with the detection plotter, use the clearData function.
Version History
Introduced in R2017a