isOpen
Return true if geoplayer figure is visible
Syntax
Description
Examples
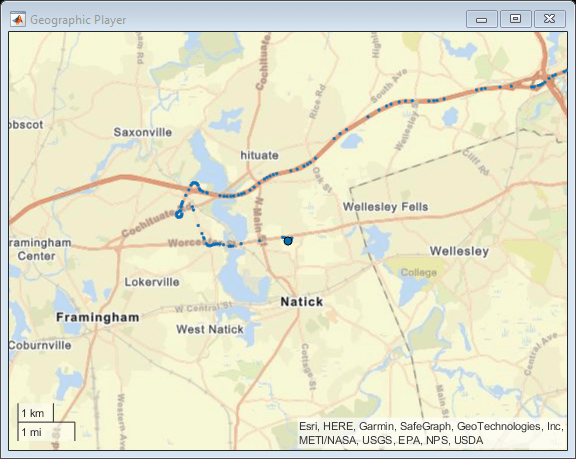
Load a sequence of latitude and longitude coordinates.
data = load('geoRoute.mat');Create a geographic player with a zoom level of 12. Configure the player to display all points in its history.
player = geoplayer(data.latitude(1),data.longitude(1),12,'HistoryDepth',Inf);Display the geographic coordinates in a sequence by using the plotPosition function. Put the call to plotPosition inside a while loop, so that the player plots points only while the figure is open. You can exit the loop by closing the figure. If you do not close the figure, then the loop automatically exits when all points are plotted.
i = 1;
numPoints = length(data.latitude);
while isOpen(player) && i<=numPoints
    plotPosition(player,data.latitude(i),data.longitude(i))
    pause(0.1)
    i=i+1;
end
To make the figure visible again, use the show function.
show(player)
Input Arguments
Output Arguments
Version History
Introduced in R2018a
1 Alignment of boundaries and region labels are a presentation of the feature provided by the data vendors and do not imply endorsement by MathWorks®.