infer
Infer univariate ARIMA or ARIMAX model residuals or conditional variances
Syntax
Description
Tbl2 = infer(Mdl,Tbl1)Tbl2 containing paths of
residuals and conditional variances inferred from the model
Mdl and the response data in the input table or
timetable Tbl1. (since R2023b)
infer selects the response variable named in
Mdl.SeriesName or the sole variable in
Tbl1. To select a different response variable in
Tbl1 to infer residuals and conditional variances, use
the ResponseVariable name-value argument.
[___] = infer(___,
specifies options using one or more name-value arguments in
addition to any of the input argument combinations in previous syntaxes.
Name=Value)infer returns the output argument combination for the
corresponding input arguments. For example, infer(Mdl,Y,Y0=PS,X=Pred) infers
residuals from the numeric vector of responses Y with
respect to the ARIMAX Mdl, and specifies the numeric vector
of presample response data PS to initialize the model and the
exogenous predictor data Pred for the regression
component.
Examples
Infer residuals from an AR model by supplying a hypothetical response series in a vector.
Specify an AR(2) model using known parameters.
Mdl = arima(AR={0.5 -0.8},Constant=0.002, ...
Variance=0.8);Simulate response data with 100 observations.
rng(1,"twister");
Y = simulate(Mdl,100);Y is a 100-by-1 vector containing a random response path drawn from Mdl.
Infer residuals for all corresponding responses.
E = infer(Mdl,Y);
E is a 100-by-1 vector containing a residuals corresponding to Y, with respect to Mdl. By default, infer backcasts for required presample observations.
Plot the residuals.
figure
plot(E)
title("Inferred Residuals")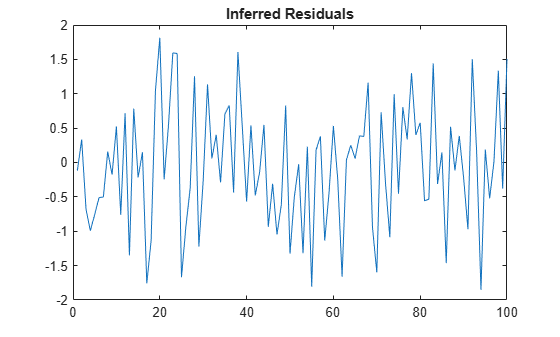
Infer the conditional variances from an AR(1) and GARCH(1,1) composite model. Return the loglikelihood value.
Specify an AR(1) model using known parameters. Set the variance equal to a garch model.
Mdl = arima(AR={0.8 -0.3},Constant=0);
MdlVar = garch(Constant=0.0002,GARCH=0.6,ARCH=0.2);
Mdl.Variance = MdlVar;
Simulate response data with 100 observations.
rng(1,"twister")
Y = simulate(Mdl,100);
Infer residuals and conditional variances for the entire response series. Compute the loglikelihood at the simulated data.
[E,V,logL] = infer(Mdl,Y);
logL
logL =
209.6405
E and V are 100-by-1 vectors of inferred residuals and conditional variances, given the response data and model.
Plot the conditional variances.
figure
plot(V)
title("Inferred Conditional Variances")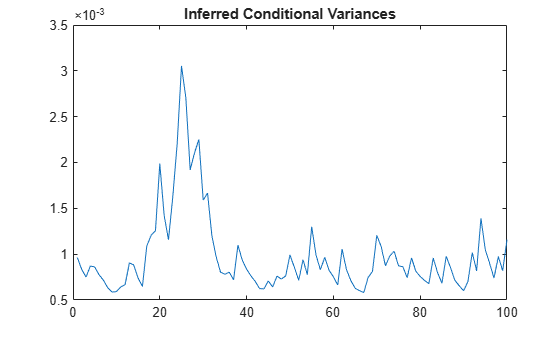
Infer residuals from an AR model by supplying a hypothetical response series in a vector. Supply presample responses to initialize the model.
Specify an AR(2) model using known parameters.
Mdl = arima(AR={0.5 -0.8},Constant=0.002, ...
	Variance=0.8)
Mdl =
arima with properties:
Description: "ARIMA(2,0,0) Model (Gaussian Distribution)"
SeriesName: "Y"
Distribution: Name = "Gaussian"
P: 2
D: 0
Q: 0
Constant: 0.002
AR: {0.5 -0.8} at lags [1 2]
SAR: {}
MA: {}
SMA: {}
Seasonality: 0
Beta: [1×0]
Variance: 0.8
Consider inferring residuals from a response series of length T = 100. Because the model requires Mdl.P responses to initialize the model, simulate T + Mdl.P = 102 responses from the model.
rng(1,"twister");
T = 100;
TSim = T + Mdl.P;
y = simulate(Mdl,TSim);
Y is a 102-by-1 vector representing a random response path drawn from the model.
Infer residuals from the last T response and use the first Mdl.P observations as a presample to initialize the model.
E = infer(Mdl,y((Mdl.P+1):end),Y0=y(1:Mdl.P));
size(E)
ans = 1×2

   100     1
E is a 100-by-1 vector containing a residuals corresponding to the last 100 observations of y, with respect to Mdl.
Plot the residuals.
figure
plot(E)
title("Inferred Residuals")
Since R2023b
Fit an ARIMA(1,1,1) model to the weekly average NYSE closing prices. Supply timetables of in-sample and presample data for the fit. Then, infer the residuals from the fit.
Load Data
Load the US equity index data set Data_EquityIdx.
load Data_EquityIdx
T = height(DataTimeTable)
T = 3028
The timetable DataTimeTable includes the time series variable NYSE, which contains daily NYSE composite closing prices from January 1990 through December 2001.
Plot the daily NYSE price series.
figure
plot(DataTimeTable.Time,DataTimeTable.NYSE)
title("NYSE Daily Closing Prices: 1990 - 2001")
Prepare Timetable for Estimation
When you plan to supply a timetable, you must ensure it has all the following characteristics:
The selected response variable is numeric and does not contain any missing values.
The timestamps in the
Timevariable are regular, and they are ascending or descending.
Remove all missing values from the timetable, relative to the NYSE price series.
DTT = rmmissing(DataTimeTable,DataVariables="NYSE");
T_DTT = height(DTT)
T_DTT = 3028
Because all sample times have observed NYSE prices, rmmissing does not remove any observations.
Determine whether the sampling timestamps have a regular frequency and are sorted.
areTimestampsRegular = isregular(DTT,"days")areTimestampsRegular = logical
0
areTimestampsSorted = issorted(DTT.Time)
areTimestampsSorted = logical
   1
areTimestampsRegular = 0 indicates that the timestamps of DTT are irregular. areTimestampsSorted = 1 indicates that the timestamps are sorted. Business day rules make daily macroeconomic measurements irregular.
Remedy the time irregularity by computing the weekly average closing price series of all timetable variables.
DTTW = convert2weekly(DTT,Aggregation="mean");
areTimestampsRegular = isregular(DTTW,"weeks")
areTimestampsRegular = logical
   1
T_DTTW = height(DTTW)
T_DTTW =
627
DTTW is regular.
figure
plot(DTTW.Time,DTTW.NYSE)
title("NYSE Daily Closing Prices: 1990 - 2001")
Create Model Template for Estimation
Suppose that an ARIMA(1,1,1) model is appropriate to model NYSE composite series during the sample period.
Create an ARIMA(1,1,1) model template for estimation.
Mdl = arima(1,1,1);
Mdl is a partially specified arima model object.
Fit Model to Data
infer requires Mdl.P presample observations to initialize the model. infer backcasts for necessary presample responses, but you can provide a presample.
Partition the data into presample and in-sample, or estimation sample, observations.
T0 = Mdl.P;
DTTW0 = DTTW(1:T0,:);
DTTW1 = DTTW((T0+1):end,:);
Fit an ARIMA(1,1,1) model to the in-sample weekly average NYSE closing prices. Specify the response variable name, presample timetable, and the presample response variable name.
EstMdl = estimate(Mdl,DTTW1,ResponseVariable="NYSE", ...
    Presample=DTTW0,PresampleResponseVariable="NYSE");
    ARIMA(1,1,1) Model (Gaussian Distribution):

                 Value      StandardError    TStatistic      PValue
                ________    _____________    __________    ___________

    Constant     0.83623         0.453          1.846         0.064892
    AR{1}       -0.32862       0.23526        -1.3968          0.16247
    MA{1}        0.42703       0.22613         1.8884         0.058967
    Variance      56.065        1.8433         30.416      3.3798e-203
EstMdl is a fully specified, estimated arima model object.
Infer Residuals
Infer the residuals from the fitted model and in-sample observations. Specify the response variable name, presample timetable, and the presample response variable name.
Tbl2 = infer(EstMdl,DTTW1,ResponseVariable="NYSE", ...
    Presample=DTTW0,PresampleResponseVariable="NYSE");
tail(Tbl2)
       Time         NYSE     NASDAQ    Y_Residual    Y_Variance
    ___________    ______    ______    __________    __________

    16-Nov-2001    577.11    1886.9      5.8649        56.065
    23-Nov-2001       583    1898.3      5.3303        56.065
    30-Nov-2001    581.41    1925.8     -2.7678        56.065
    07-Dec-2001    584.96    1998.1      3.3787        56.065
    14-Dec-2001    574.03      1981     -12.038        56.065
    21-Dec-2001     582.1    1967.9      8.7774        56.065
    28-Dec-2001    590.28    1967.2      6.2526        56.065
    04-Jan-2002     589.8    1950.4     -1.3008        56.065
size(Tbl2)
ans = 1×2

   625     4
Tbl2 is a 625-by-4 timetable containing all variables in DTTW1, and the inferred residuals from the fit NYSE_Response and constant variance paths NYSE_Variance (Mdl.Variance = 56.065).
Since R2023b
Fit an ARIMA(1,1,1) model to the weekly average NYSE closing prices. Supply a timetable of data and specify the series for the fit. Then, compute fitted responses.
Load the US equity index data set Data_EquityIdx.
load Data_EquityIdx
T = height(DataTimeTable)
T = 3028
Remedy the time irregularity by computing the weekly average closing price series of all timetable variables.
DTTW = convert2weekly(DataTimeTable,Aggregation="mean");
T_DTTW = height(DTTW)
T_DTTW = 627
Create an ARIMA(1,1,1) model template for estimation. Set the response series name to NYSE.
Mdl = arima(1,1,1);
Mdl.SeriesName = "NYSE";
Partition the data into presample and in-sample, or estimation sample, observations.
T0 = Mdl.P;
DTTW0 = DTTW(1:T0,:);
DTTW1 = DTTW((T0+1):end,:);
Fit an ARIMA(1,1,1) model to the in-sample weekly average NYSE closing prices. Specify the presample timetable, and the presample response variable name.
EstMdl = estimate(Mdl,DTTW1,Presample=DTTW0, ...
    PresampleResponseVariable="NYSE");
    ARIMA(1,1,1) Model (Gaussian Distribution):

                 Value      StandardError    TStatistic      PValue
                ________    _____________    __________    ___________

    Constant     0.83623         0.453          1.846         0.064891
    AR{1}       -0.32862       0.23526        -1.3968          0.16247
    MA{1}        0.42703       0.22613         1.8884         0.058966
    Variance      56.065        1.8433         30.416      3.3799e-203
Infer the residuals from the fitted model and in-sample observations. Specify the presample timetable, and the presample response variable name.
Tbl2 = infer(EstMdl,DTTW1,Presample=DTTW0, ...
    PresampleResponseVariable="NYSE");
Compute fitted response values by subtracting the residuals from the observed response series.
Tbl2.YHat = Tbl2.NYSE - Tbl2.NYSE_Residual;
Plot the observed responses and the fitted values.
figure
plot(Tbl2.Time,[Tbl2.NYSE Tbl2.YHat])
legend("Observations","Fitted values")
title("NYSE Weekly Average Price Series")

The fitted values closely track the observations.
Plot the residuals versus the fitted values.
figure
plot(Tbl2.YHat,Tbl2.NYSE_Residual,".",MarkerSize=15)
ylabel("Residuals")
xlabel("Fitted Values")
title("Residual Plot")

Residual variance appears larger for larger fitted values. One remedy for this behavior is to apply the log transform to the data.
Infer residuals from an ARMAX model.
Specify an ARMA(1,2) model using known parameters for the response (MdlY) and an AR(1) model for the predictor data (MdlX).
MdlY = arima(AR=0.2,MA={-0.1,0.6},Constant=1, ...
    Variance=2,Beta=3)
MdlY =
arima with properties:
Description: "ARIMAX(1,0,2) Model (Gaussian Distribution)"
SeriesName: "Y"
Distribution: Name = "Gaussian"
P: 1
D: 0
Q: 2
Constant: 1
AR: {0.2} at lag [1]
SAR: {}
MA: {-0.1 0.6} at lags [1 2]
SMA: {}
Seasonality: 0
Beta: [3]
Variance: 2
MdlX = arima(AR=0.3,Constant=0,Variance=1);
If you do not specify presample responses, infer requires at least T + MdlY.P predictor observations to simulate a response series of length T.
Consider simulating a response series of length 100. Simulate a predictor series of length 101, and then simulate the response series. Provide the predictor data to simulate for the exogenous regression component.
rng(1,"twister") % For reproducibility
T = 100;
Pred = simulate(MdlX,T + MdlY.P);
Y = simulate(MdlY,T,X=Pred);
Infer residuals using the entire series.
E = infer(MdlY,Y,X=Pred);
figure
plot(E)
title("Inferred Residuals") 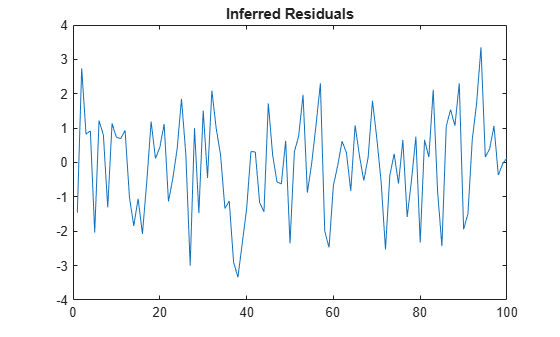
Input Arguments
Name-Value Arguments
Output Arguments
Algorithms
If you supply data in the table or timetable Tbl1 to estimate an
ARIMAX model, infer cannot backcast for presample responses.
Therefore, if you specify PredictorVariables, you must also specify
presample response data by using the Presample and
PresampleResponseVariable name-value arguments.
References
[1] Box, G. E. P., G. M. Jenkins, and G. C. Reinsel. Time Series Analysis: Forecasting and Control 3rd ed. Englewood Cliffs, NJ: Prentice Hall, 1994.
[2] Enders, W. Applied Econometric Time Series. Hoboken, NJ: John Wiley & Sons, 1995.
[3] Hamilton, J. D. Time Series Analysis. Princeton, NJ: Princeton University Press, 1994.