Forecast Conditional Mean and Variance Model
This example shows how to forecast responses and conditional variances from a composite conditional mean and variance model.
Step 1. Load the data and fit a model.
Load the NASDAQ data included with the toolbox. Fit a conditional mean and variance model to the data.
load Data_EquityIdx
nasdaq = DataTable.NASDAQ;
r = price2ret(nasdaq);
N = length(r);

Mdl = arima('ARLags',1,'Variance',garch(1,1),...
              'Distribution','t');
EstMdl = estimate(Mdl,r,'Variance0',{'Constant0',0.001});
    ARIMA(1,0,0) Model (t Distribution):

                  Value       StandardError    TStatistic      PValue
                __________    _____________    __________    __________

    Constant    0.00094926     0.00017069        5.5613       2.677e-08
    AR{1}          0.13984       0.019064        7.3353       2.212e-13
    DoF              8.407         1.0359        8.1155      4.8361e-16


    GARCH(1,1) Conditional Variance Model (t Distribution):

                  Value       StandardError    TStatistic      PValue
                __________    _____________    __________    __________

    Constant    1.6318e-06     6.1787e-07         2.641       0.0082662
    GARCH{1}       0.89643       0.011239        79.763               0
    ARCH{1}       0.095599       0.011002         8.689      3.6559e-18
    DoF              8.407         1.0359        8.1155      4.8361e-16
[E0,V0] = infer(EstMdl,r);
Step 2. Forecast returns and conditional variances.
Use forecast to compute MMSE forecasts of the returns and conditional variances for a 1000-period future horizon. Use the observed returns and inferred residuals and conditional variances as presample data.
[Y,YMSE,V] = forecast(EstMdl,1000,r,'E0',E0,'V0',V0);
upper = Y + 1.96*sqrt(YMSE);
lower = Y - 1.96*sqrt(YMSE);

figure
subplot(2,1,1)
plot(r,'Color',[.75,.75,.75])
hold on
plot(N+1:N+1000,Y,'r','LineWidth',2)
plot(N+1:N+1000,[upper,lower],'k--','LineWidth',1.5)
xlim([0,N+1000])
title('Forecasted Returns')
hold off
subplot(2,1,2)
plot(V0,'Color',[.75,.75,.75])
hold on
plot(N+1:N+1000,V,'r','LineWidth',2);
xlim([0,N+1000])
title('Forecasted Conditional Variances')
hold off
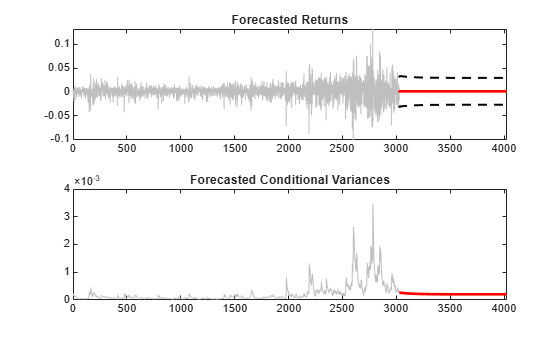
The conditional variance forecasts converge to the asymptotic variance of the GARCH conditional variance model. The forecasted returns converge to the estimated model constant (the unconditional mean of the AR conditional mean model).