plotOrientation
Plot set of orientations in orientation plotter
Syntax
Description
plotOrientation(
specifies the orientations of M objects to show for the orientation
plotter, oPlotter,orientations)oPlotter. The orientations argument can
be either an M-by-1 array of quaternions, or a
3-by-3-by-M array of rotation matrices.
Examples
This example shows how to animate the orientation of an oscillating device.
Load rpy_9axis.mat. The data in rpy_9axis.mat is recorded accelerometer, gyroscope, and magnetometer sensor data from a device oscillating in pitch (around y-axis), then yaw (around z-axis), then roll (around x-axis). The device's x-axis was pointing southward when recorded.
ld = load('rpy_9axis.mat')ld = struct with fields:
Fs: 200
sensorData: [1×1 struct]
Set the sampling frequency. Extract the accelerometer and gyroscope data. Set the decimation factor to 2. Use fuse to create an indirect Kalman sensor fusion filter from the data.
accel = ld.sensorData.Acceleration;
gyro = ld.sensorData.AngularVelocity;
Fs  = ld.Fs;
decim = 2;
fuse = imufilter('SampleRate',Fs,'DecimationFactor',decim);
Obtain the pose information of the fused data.
pose = fuse(accel,gyro);
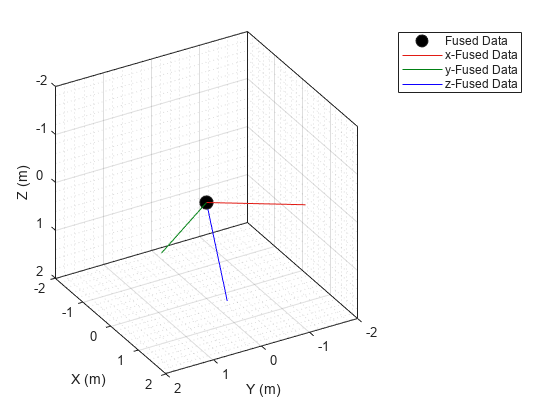
Create a theater plot. Add to the theater plot an orientation plotter with 'DisplayName' set to 'Fused Data' and 'LocalAxesLength' set to 2.
tp = theaterPlot('XLimit',[-2 2],'YLimit',[-2 2],'ZLimit',[-2 2]);
op = orientationPlotter(tp,'DisplayName','Fused Data',...
    'LocalAxesLength',2);
Loop through the pose information to animate the changing orientation.
for i=1:numel(pose)
    plotOrientation(op, pose(i))
    drawnow
end
Input Arguments
Version History
Introduced in R2018b
See Also
theaterPlot | orientationPlotter | clearData | clearPlotterData