orientationPlotter
Create orientation plotter
Description
oPlotter = orientationPlotter(tp)tp.
oPlotter = orientationPlotter(tp,Name,Value)Name,Value pair arguments.
Examples
This example shows how to animate the orientation of an oscillating device.
Load rpy_9axis.mat. The data in rpy_9axis.mat is recorded accelerometer, gyroscope, and magnetometer sensor data from a device oscillating in pitch (around y-axis), then yaw (around z-axis), then roll (around x-axis). The device's x-axis was pointing southward when recorded.
ld = load('rpy_9axis.mat')ld = struct with fields:
Fs: 200
sensorData: [1×1 struct]
Set the sampling frequency. Extract the accelerometer and gyroscope data. Set the decimation factor to 2. Use fuse to create an indirect Kalman sensor fusion filter from the data.
accel = ld.sensorData.Acceleration;
gyro = ld.sensorData.AngularVelocity;
Fs  = ld.Fs;
decim = 2;
fuse = imufilter('SampleRate',Fs,'DecimationFactor',decim);
Obtain the pose information of the fused data.
pose = fuse(accel,gyro);
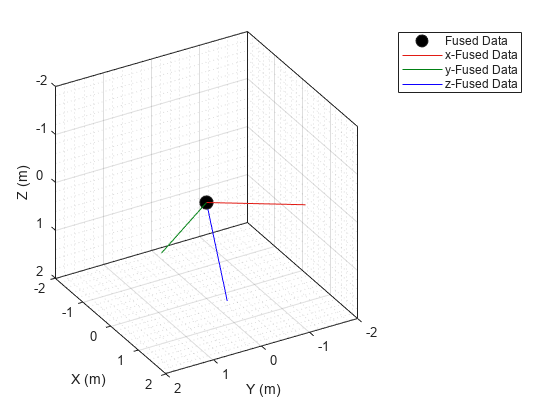
Create a theater plot. Add to the theater plot an orientation plotter with 'DisplayName' set to 'Fused Data' and 'LocalAxesLength' set to 2.
tp = theaterPlot('XLimit',[-2 2],'YLimit',[-2 2],'ZLimit',[-2 2]);
op = orientationPlotter(tp,'DisplayName','Fused Data',...
    'LocalAxesLength',2);
Loop through the pose information to animate the changing orientation.
for i=1:numel(pose)
    plotOrientation(op, pose(i))
    drawnow
end
Input Arguments
Name-Value Arguments
Specify optional pairs of arguments as
Name1=Value1,...,NameN=ValueN, where Name is
the argument name and Value is the corresponding value.
Name-value arguments must appear after other arguments, but the order of the
pairs does not matter.
Before R2021a, use commas to separate each name and value, and enclose
Name in quotes.
Example: 'HistoryDepth',6
Plot name to display in legend, specified as the comma-separated pair consisting of 'DisplayName' and a character vector or string scalar. If no name is specified, no entry is shown.
Example: 'DisplayName','Radar Detections'
Number of previous track updates to display, specified as the comma-separated pair
consisting of 'HistoryDepth' and a nonnegative integer less than or
equal to 100. If set to 0, then no previous updates are rendered.
Marker symbol, specified as the comma-separated pair consisting of
'Marker' and one of these symbols.
| Marker | Description | Resulting Marker |
|---|---|---|
"o" | Circle |
|
"+" | Plus sign |
|
"*" | Asterisk |
|
"." | Point |
|
"x" | Cross |
|
"_" | Horizontal line |
|
"|" | Vertical line |
|
"square" | Square |
|
"diamond" | Diamond |
|
"^" | Upward-pointing triangle |
|
"v" | Downward-pointing triangle |
|
">" | Right-pointing triangle |
|
"<" | Left-pointing triangle |
|
"pentagram" | Pentagram |
|
"hexagram" | Hexagram |
|
"none" | No markers | Not applicable |
Size of marker, specified in points as the comma-separated pair consisting of
'MarkerSize' and a positive integer.
Marker outline color, specified as the comma-separated pair consisting of
'MarkerEdgeColor' and a character vector, string scalar, an RGB
triplet, or a hexadecimal color code. The default color is
'black'.
Marker outline color, specified as the comma-separated pair consisting of
'MarkerFaceColor' and a character vector, a string scalar, an
RGB triplet, a hexadecimal color code, or 'none'. The default is
'none'.
Font size for labeling tracks, specified as the comma-separated pair consisting of
'FontSize' and a positive integer that represents font point
size.
Gap between label and positional point it annotates, specified as the
comma-separated pair consisting of 'LabelOffset' and a
three-element row vector. Specify the [x
y
z] offset in meters.
Length of line used to denote each of the local x-,
y-, and z-axes of the given orientation,
specified as the comma-separated pair consisting of
'LocalAxesLength' and a positive scalar.
'LocalAxesLength' is in meters.
Tag to associate with the plotter, specified as the comma-separated pair
consisting of 'Tag' and a character vector or string scalar. The
default value is 'PlotterN', where
N is an integer that corresponds to the Nth
plotter associated with the theaterPlot.
Tags provide a way to identify plotter objects, for example when searching using
findPlotter.
Version History
Introduced in R2018b
See Also
theaterPlot | plotOrientation | clearData | clearPlotterData