displayColorPatch
Display measured and reference color as color patches
Description
displayColorPatch( displays
measured and reference colors, colorValues)colorValues, for color patch
regions of interest (ROIs) in a test chart. The function displays measured color
values as squares surrounded by a thick boundary of the corresponding reference
color.
displayColorPatch(
displays measured color values with additional name-value arguments to control
aspects of the display.colorValues,Name,Value)
Examples
Read an image of a ColorChecker® chart into the workspace.
I = imread("colorCheckerTestImage.jpg");Create a colorChecker object, then display the chart with ROI annotations.
chart = colorChecker(I);
displayChart(chart,"displayRegistrationPoints",false)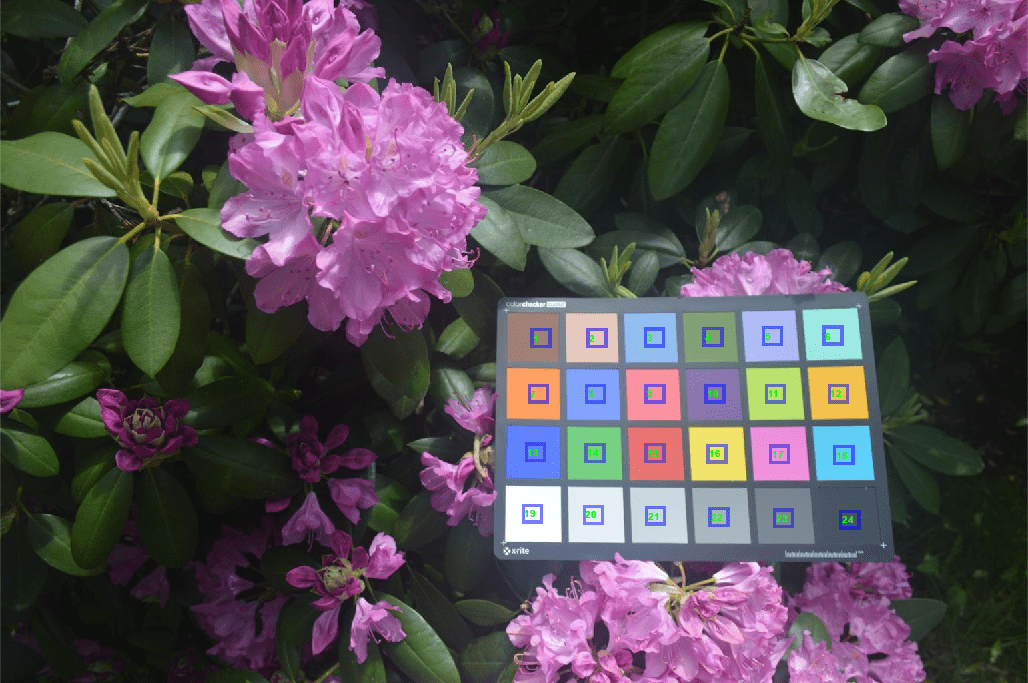
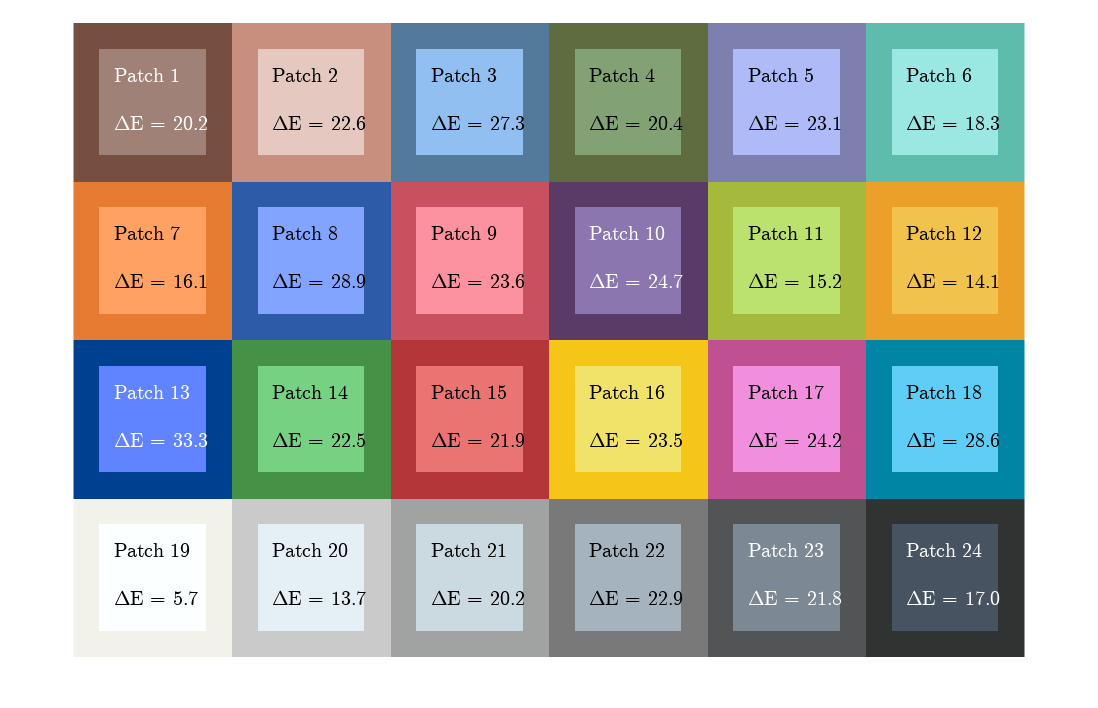
Measure the color in each color patch ROI.
colorTable = measureColor(chart);
On a color patch diagram, display the measured and reference colors and the color error ().
displayColorPatch(colorTable)
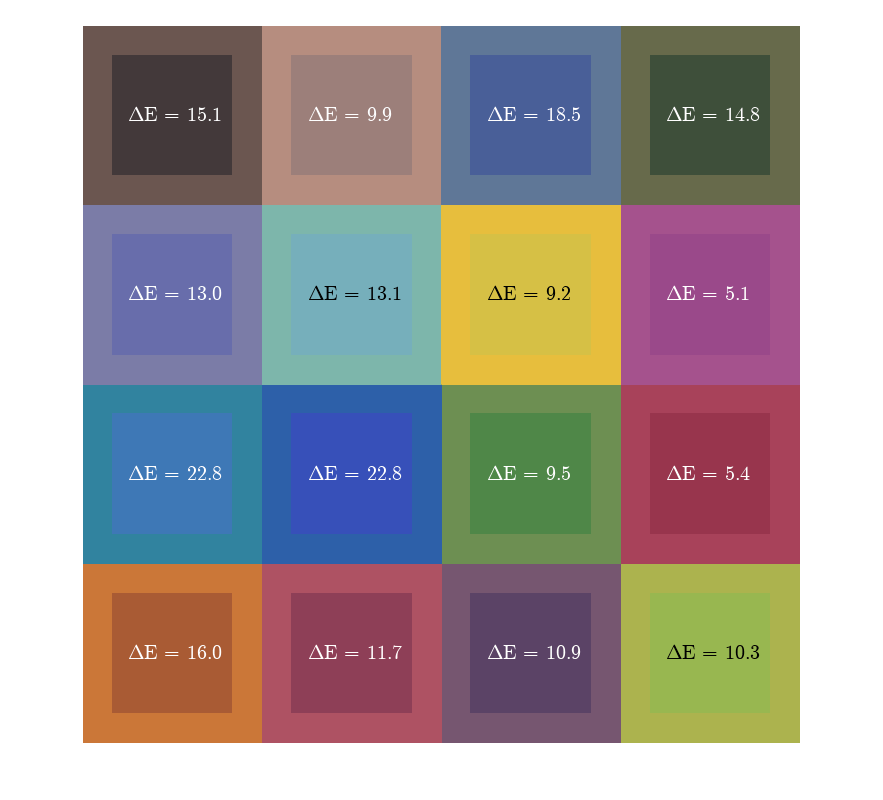
This example shows how to display the color patch diagram from measurements of color accuracy on an Imatest® eSFR chart.
Read an image of an eSFR chart into the workspace.
I = imread("eSFRTestImage.jpg");Create an esfrChart object. Display the chart, highlighting the 16 color patches.
chart = esfrChart(I);
displayChart(chart,displayEdgeROIs=false, ...
    displayGrayROIs=false,displayRegistrationPoints=false)
Measure the color in all color patch ROIs.
colorTable = measureColor(chart);
Display the color accuracy measurements without the ROI index overlay. Each square color patch is the measured color, and the thick surrounding border is the reference color for that ROI. The color accuracy measurement is displayed as Delta_E, the Euclidean distance between measured and reference colors in CIE 1976 L*a*b* color space. More accurate colors have a smaller Delta_E.
displayColorPatch(colorTable,displayROIIndex=false)
Input Arguments
Name-Value Arguments
Tips
The reference L*a*b* values of the colors measured from a
colorCheckerobject are for the "After November 2014" version of the ColorChecker® chart. The white point of the reference values is the CIE standard illuminant D50.
Version History
Introduced in R2017b