Main Content

vec2mtx

Convert latitudes and longitudes to raster data grid

    Description

    [Z,R] = vec2mtx(lat,lon,cellsPerDegree) creates a regular raster data grid Z and geographic raster reference object R from the latitudes and longitudes in lat and lon, respectively. When a grid cell in Z corresponds to a location specified by lat and lon, the function sets the grid cell to 1. Otherwise, the function sets the grid cell to 0. Specify the number of grid cells per degree of latitude and longitude using cellsPerDegree.

    This function is useful for creating raster data from vector data.

    example

    [Z,R] = vec2mtx(lat,lon,cellsPerDegree,latlim,lonlim) specifies the latitude limits latlim and longitude limits lonlim of the grid.

    [Z,R] = vec2mtx(lat,lon,Zin,Rin) specifies the geographic limits and the number of grid cells per degree using the regular raster data grid Zin and geographic raster reference object Rin.

    example

    [Z,R] = vec2mtx(___,"filled") where lat and lon define one or more closed polygons, differentiates between cells inside the polygon boundary and outside the polygon boundary. When a grid cell is inside a polygon boundary, the function sets the grid cell to 0. When a grid cell is on a polygon boundary, the function sets the grid cell to 1. When a grid cell is outside all the polygon boundaries, the function sets the grid cell to 2.

    example

    Examples

    collapse all

    Load a MAT file containing global coastline coordinates into the workspace. The variables within the MAT file, coastlat and coastlon, specify numeric latitude and longitude coordinates, respectively.

    load coastlines

    Convert the coordinates to a regular raster data grid and a geographic raster reference object. Specify 1 grid cell per degree of latitude and longitude. The vec2mtx function indicates that a grid cell corresponds to a coastline coordinate using 1 and uses 0 otherwise.

    [Z,R] = vec2mtx(coastlat,coastlon,1);

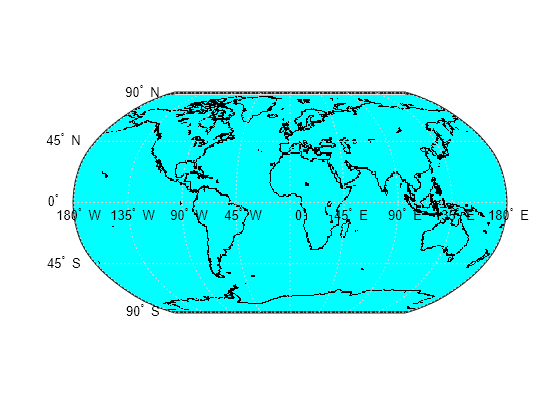
    Display the raster data on a map. Use black for the coastlines (Z == 1) and cyan for the other regions (Z == 0).

    figure 
    worldmap world
    geoshow(Z,R,"DisplayType","texturemap")
    colormap([0 1 1; 0 0 0])

    Figure contains an axes object. The hidden axes object contains 18 objects of type patch, surface, line, text.

    Read a shapefile containing US state polygons into the workspace as a geospatial table. Extract the coordinates of the polygons by converting the geospatial table to a table.

    states = readgeotable("usastatelo.shp");
    T = geotable2table(states,["Latitude" "Longitude"]);
    [lat,lon] = polyjoin(T.Latitude',T.Longitude');

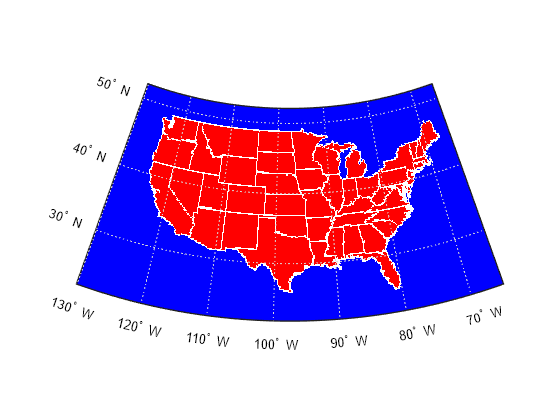
    Convert the coordinates to a regular raster data grid and a geographic raster reference object. Specify 5 grid cells per degree of latitude and longitude. When you specify the "filled" option, the vec2mtx function indicates that a grid cell is inside a polygon using 0, on a polygon boundary using 1, and outside all the polygons using 2.

    [Z,R] = vec2mtx(lat,lon,5,"filled");

    Display the raster data on a map. Use red for regions inside a polygon (Z == 0), white for regions on a boundary (Z == 1), and blue for regions outside all the polygons (Z == 2).

    figure 
    usamap(Z,R)
    geoshow(Z,R,"DisplayType","texturemap")
    colormap([1 0 0; 1 1 1; 0 0 1])

    Figure contains an axes object. The hidden axes object contains 14 objects of type patch, surface, line, text.

    Read a shapefile containing US state polygons into the workspace as a geospatial table. Extract the coordinates of the state boundaries by converting the geospatial table to a table.

    states = readgeotable("usastatelo.shp");
    T = geotable2table(states,["Latitude" "Longitude"]);
    [lat,lon] = polyjoin(T.Latitude',T.Longitude');

    Create a reference object by using the georefcells function and specifying the geographic limits and extent of each cell (the inverse of the number of cells per degree). For this example, choose limits that include the conterminous US.

    latlim = [22 52];
    lonlim = [-130 -65];
    cellsPerDegree = 5;
    R = georefcells(latlim,lonlim,1/cellsPerDegree,1/cellsPerDegree);

    Create a raster of zeros with a size that is consistent with R.

    Z = zeros(R.RasterSize);

    Overwrite Z and R with a new raster data grid that includes the state boundaries and interiors.

    [Z,R] = vec2mtx(lat,lon,Z,R,"filled");

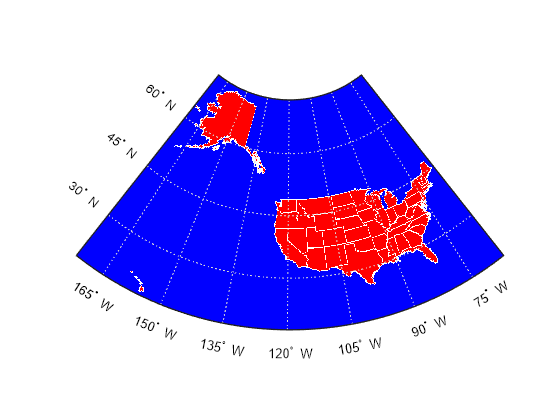
    Plot the result on a map. Use red for the interior regions, white for the boundaries, and blue for the exterior regions.

    figure
    usamap(Z,R)
    geoshow(Z,R,"DisplayType","texturemap")
    colormap([1 0 0; 1 1 1; 0 0 1])

    Figure contains an axes object. The hidden axes object contains 14 objects of type patch, surface, line, text.

    The vec2mtx function enables you to create raster data grids with two classification values (when lat and lon represent lines) or three classification values (when lat and lon represent polygons). To create a raster data grid with additional classification values, you can use vec2mtx multiple times and combine the output grids.

    Read two files into the workspace:

    • A MAT file containing global coastline coordinates. The variables within the MAT file, coastlat and coastlon, specify numeric latitude and longitude coordinates, respectively.

    • A shapefile containing lines that represent world rivers. Extract the latitude and longitude coordinates of the lines.

    load coastlines
    rivers = readgeotable("worldrivers.shp");
    T = geotable2table(rivers,["Latitude" "Longitude"]);
    [latRiver,lonRiver] = polyjoin(T.Latitude',T.Longitude');

    Convert the coastline coordinates to a regular raster data grid and a geographic raster reference object. Specify 1 cell per degree of latitude and longitude. When you specify the "filled" option, the vec2mtx function creates the grid using these rules:

    • When a grid cell corresponds to an area inside a coastline, use 0. These grid cells are land areas.

    • When a grid cell corresponds to an area on a coastline, use 1.

    • When a grid cell corresponds to an around outside a coastline, use 2. These grid cells are ocean areas.

    [Z,R] = vec2mtx(coastlat,coastlon,1,"filled");

    Convert the world river coordinates to a regular raster data grid and a geographic raster reference object. When you specify a raster data grid and a reference object as input, the vec2mtx function creates the new grid and reference object using the same latitude limits and number of cells per degree as the input reference object. The function creates the grid using these rules:

    • When a grid cell does not correspond to a river coordinate, use 0.

    • When a grid cell corresponds to a river coordinate, use 1.

    [riverZ,riverR] = vec2mtx(latRiver,lonRiver,Z,R);

    Verify that the reference objects are the same.

    isequal(R,riverR)
    ans = logical
       1


    Find the indices of the river grid that correspond to river coordinates. Then, replace those elements of the coastline grid with the value 3. As a result, each element of the coastline grid is one of four values (0, 1, 2, or 3).

    idx = riverZ == 1;
    Z(idx) = 3;

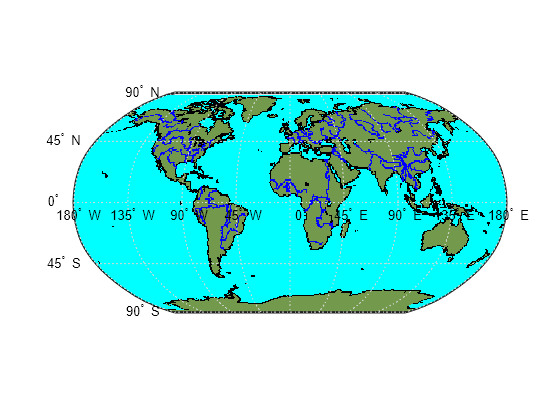
    Display the grid on a map. Use green for the land areas, black for the coastlines, cyan for the ocean areas, and blue for the rivers.

    figure
    worldmap world
    geoshow(Z,R,"DisplayType","texturemap")
    
    landColor = [0.45 0.60 0.30];
    coastColor = [0 0 0];
    oceanColor = [0 1 1];
    riverColor = [0 0 1];
    colormap([landColor; coastColor; oceanColor; riverColor])

    Figure contains an axes object. The hidden axes object contains 18 objects of type patch, surface, line, text.

    Input Arguments

    collapse all

    Latitude values, in degrees, specified as a vector.

    To specify polygons, separate the vertices of each polygon using NaN values, such as [37 46 31 20 37 NaN 45 49 35 32 45 NaN 35 40 42 35]. The NaN values in lat must correspond to the NaN values in lon.

    The size of lat must match the size of lon.

    Data Types: single | double

    Longitude values, in degrees, specified as a vector.

    To specify polygons, separate the vertices of each polygon using NaN values, such as [69 90 105 79 69 NaN 6 52 43 14 6 NaN 18 32 22 18]. The NaN values in lon must correspond to the NaN values in lat.

    The size of lon must match the size of lat.

    Data Types: single | double

    Number of grid cells per degree of latitude and longitude, specified as a scalar.

    Data Types: double

    Latitude limits, in degrees, specified as a two-element vector.

    Data Types: double

    Longitude limits, in degrees, specified as a two-element vector.

    Data Types: double

    Input raster data grid, specified as a numeric array.

    The size of Zin must be consistent with the RasterSize property of Rin.

    Input geographic raster reference object, specified as a GeographicCellsReference object.

    The RasterSize property of Rin must be consistent with the size of Zin.

    When you specify Rin, the output argument R is equal to Rin.

    Output Arguments

    collapse all

    Raster data grid, returned as a numeric array.

    Geographic raster reference object, returned as a GeographicCellsReference object.

    Tips

    • When possible, the vec2mtx function includes a buffer of two grid cells on each of the four sides of the grid. The function can include fewer buffer cells to ensure that the latitude limits are in the range of [–90, 90] degrees, and that the difference in longitude limits is less than 360 degrees.
    Version History

    Introduced before R2006a

    expand all

    See Also

    Functions

    Objects