Histograms of Tall Arrays
This example shows how to use histogram and histogram2 to analyze and visualize data contained in a tall array.
Create Tall Table
Create a datastore using the airlinesmall.csv data set. Treat 'NA' values as missing data so that they are replaced with NaN values. Select a subset of the variables to work with. Convert the datastore into a tall table.
varnames = {'ArrDelay', 'DepDelay', 'Year', 'Month'};
ds = tabularTextDatastore('airlinesmall.csv', 'TreatAsMissing', 'NA', ...
    'SelectedVariableNames', varnames);
T = tall(ds)
T =
M×4 tall table
ArrDelay DepDelay Year Month
________ ________ ____ _____
8 12 1987 10
8 1 1987 10
21 20 1987 10
13 12 1987 10
4 -1 1987 10
59 63 1987 10
3 -2 1987 10
11 -1 1987 10
: : : :
: : : :
Plot Histogram of Arrival Delays
Plot a histogram of the ArrDelay variable to examine the frequency distribution of arrival delays.
h = histogram(T.ArrDelay);
Evaluating tall expression using the Local MATLAB Session:
- Pass 1 of 2: Completed in 0.51 sec
- Pass 2 of 2: Completed in 0.18 sec
Evaluation completed in 1.1 sec
title('Flight arrival delays, 1987 - 2008')
xlabel('Arrival Delay (minutes)')
ylabel('Frequency')
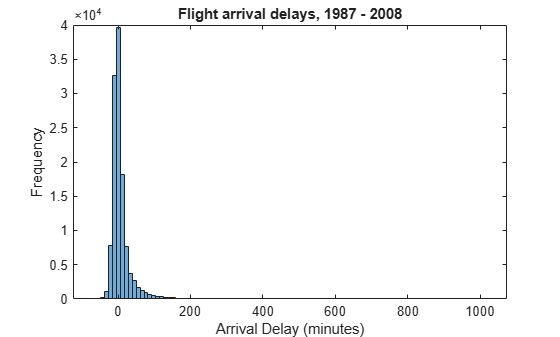
The arrival delay is most frequently a small number near 0, so these values dominate the plot and make it difficult to see other details.
Adjust Bin Limits of Histogram
Restrict the histogram bin limits to plot only arrival delays between -50 and 150 minutes. After you create a histogram object from a tall array, you cannot change any properties that would require recomputing the bins, including BinWidth and BinLimits. Also, you cannot use morebins or fewerbins to adjust the number of bins. In these cases, use histogram to reconstruct the histogram from the raw data in the tall array.
figure
histogram(T.ArrDelay,'BinLimits',[-50,150])
Evaluating tall expression using the Local MATLAB Session: - Pass 1 of 2: Completed in 0.21 sec - Pass 2 of 2: Completed in 0.17 sec Evaluation completed in 0.52 sec
title('Flight arrival delays between -50 and 150 minutes, 1987 - 2008')
xlabel('Arrival Delay (minutes)')
ylabel('Frequency')

From this plot, it appears that long delays might be more common than initially expected. To investigate further, find the probability of an arrival delay that is one hour or greater.
Probability of Delays One Hour or Greater
The original histogram returned an object h that contains the bin values in the Values property and the bin edges in the BinEdges property. You can use these properties to perform in-memory calculations.
Determine which bins contain arrival delays of one hour (60 minutes) or more. Remove the last bin edge from the logical index vector so that it is the same length as the vector of bin values.
idx = h.BinEdges >= 60;
idx(end) = [];
Use idx to retrieve the value associated with each selected bin. Add the bin values together, divide by the total number of samples, and multiply by 100 to determine the overall probability of a delay greater than or equal to one hour. Since the total number of samples is computed from the original data set, use gather to explicitly evaluate the calculation and return an in-memory scalar.
N = numel(T.ArrDelay);
P = gather(sum(h.Values(idx))*100/N)
Evaluating tall expression using the Local MATLAB Session:
- Pass 1 of 1: Completed in 0.15 sec
Evaluation completed in 0.18 sec
P =
4.4809
Overall, the odds of an arrival delay one hour or longer are about 4.5%.
Plot Bivariate Histogram of Delays by Month
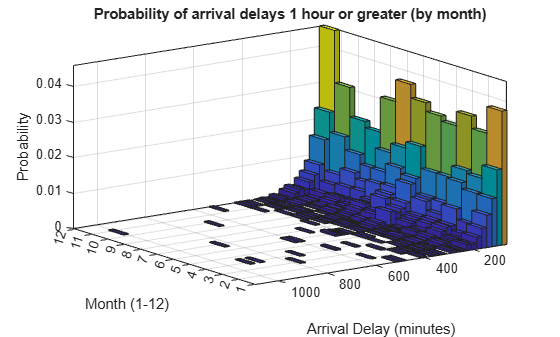
Plot a bivariate histogram of the arrival delays that are 60 minutes or longer by month. This plot examines how seasonality affects arrival delay.
figure
h2 = histogram2(T.Month,T.ArrDelay,[12 50],'YBinLimits',[60 1100],...
    'Normalization','probability','FaceColor','flat');
Evaluating tall expression using the Local MATLAB Session:
- Pass 1 of 1: Completed in 0.16 sec
Evaluation completed in 0.21 sec
Evaluating tall expression using the Local MATLAB Session:
- Pass 1 of 1: Completed in 0.18 sec
Evaluation completed in 0.21 sec
title('Probability of arrival delays 1 hour or greater (by month)')
xlabel('Month (1-12)')
ylabel('Arrival Delay (minutes)')
zlabel('Probability')
xticks(1:12)
view(-126,23)
Delay Statistics by Month
Use the bivariate histogram object to calculate the probability of having an arrival delay one hour or greater in each month, and the mean arrival delay for each month. Put the results in a table with the variable P containing the probability information and the variable MeanByMonth containing the mean arrival delay.
monthNames = {'Jan','Feb','Mar','Apr','May','Jun',...
    'Jul','Aug','Sep','Oct','Nov','Dec'}';
G = findgroups(T.Month);
M = splitapply(@(x) mean(x,'omitnan'),T.ArrDelay,G);
delayByMonth = table(monthNames, sum(h2.Values,2)*100, gather(M), ...
    'VariableNames',{'Month','P','MeanByMonth'})
Evaluating tall expression using the Local MATLAB Session: - Pass 1 of 2: Completed in 0.17 sec - Pass 2 of 2: Completed in 0.36 sec Evaluation completed in 0.91 sec
delayByMonth=12×3 table
     Month       P       MeanByMonth
    _______    ______    ___________

    {'Jan'}    9.6497      8.5954
    {'Feb'}    7.7058      7.3275
    {'Mar'}    9.0543      7.5536
    {'Apr'}    7.2504      6.0081
    {'May'}    7.4256      5.2949
    {'Jun'}     10.35      10.264
    {'Jul'}    10.228      8.7797
    {'Aug'}    8.5989      7.4522
    {'Sep'}    5.4116      3.6308
    {'Oct'}     6.042      4.6059
    {'Nov'}    6.9002      5.2835
    {'Dec'}    11.384      10.571
The results indicate that flights in the holiday month of December have an 11.4% chance of being delayed longer than an hour, but are delayed by 10.5 minutes on average. This is closely followed by the summer months of June and July, where there is about a 10% chance of being delayed an hour or more and the average delay is roughly 9 or 10 minutes.
See Also
histogram | histogram2 | tall