phased.ATIScope
Description
The phased.ATIScope
System object™ creates an angle-time intensity (ATI) scope for displaying array response
intensities as a function of time and angle of arrival. You can input two types of data –
in-phase/quadrature (I/Q) data or intensity data. In either case, the scope displays signal
magnitude or signal power.
I/Q data – The data consists of fast-time I/Q samples of pulses and sweeps from multiple sensors. The scope creates intensity data and displays the array response map. To use I/Q data, set the
IQDataInputproperty totrue. In this mode, you can set the properties shown in Properties Applicable for Processed I/Q Data.Intensity data – The data consists of angle-time array intensity data. The scope displays the angle-time intensity response map. For example, you can obtain time-angle intensity data from the output of a beamformer. To use intensity data, set the
IQDataInputproperty tofalse. In this mode, you can set the properties shown in Properties Applicable for Viewing Response Data.
To display angle-time response data:
Create the
phased.ATIScopeobject and set its properties.Call the object with arguments, as if it were a function.
To learn more about how System objects work, see What Are System Objects?
Creation
Description
scope = phased.ATIScope()
scope = phased.ATIScope(Name=Value)scope
System object with each specified property set to the specified value. See Properties for
a list of properties. You can specify additional name-value pair arguments in any order as
(Name1 = Value1, … ,NameN
= ValueN). For
example,
scope = phased.ATIScope(IQDataInput = true,IntensityUnits = "power", ...
SensorArray = phased.URA(Size = [4,3]),OperatingFrequency = 1e6)Properties
Usage
Syntax
Description
Input Arguments
Object Functions
To use an object function, specify the
System object as the first input argument. For
example, to release system resources of a System object named obj, use
this syntax:
release(obj)
Examples
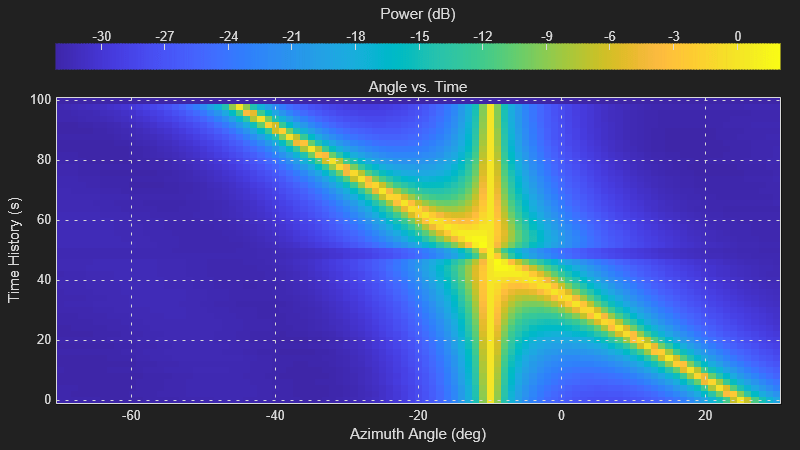
Display the directions-of-arrival (DOA) of two signals arriving at a 10-by-5 uniform rectangular array (URA).
First, create a phased.URA array System object™ containing phased.IsotropicAntennaElement System objects spaced 0.45 wavelengths apart.
fc = 200e6;
lambda = physconst('LightSpeed')/fc;
d = 0.45*lambda;
element = phased.IsotropicAntennaElement( ...
    FrequencyRange=[100e6,300e6]);
array = phased.URA(Element=element,Size=[10,5], ...
    ElementSpacing=[d,d]);
Then, create an ATIScope to process I/Q data.
scope = phased.ATIScope(IQDataInput=true, ...
    SensorArray=array, ...
    DOAMethod="mvdr", ...
    OperatingFrequency=fc, ...
    AzimuthScanAngles=-50:50, ...
    ElevationScanAngles=0, ...
    AngleLabel="Azimuth Angle (deg)", ...
    TimeSpan=100, ...
    TimeResolution=2);
Generate baseband signals at 300 and 400 Hz. The sampling rate of the baseband signals is 8 kHz.
fs = 8000;
t = (0:1/fs:1).';
x1 = exp(-1i*2*pi*t*300);
x2 = exp(-1i*2*pi*t*400);
Create two paths in azimuth-elevation space. The first path is a straight line starting at -45 degrees in azimuth and stopping at 25 degrees with 50 samples. The second path has constant azimuth of 30 degrees.
path1 = [linspace(-45,25,50); 0.0*ones(1,50)];
path2 = [-10*ones(1,50);zeros(1,50)];
xtot = [x1,x2];
for k = 1:size(path2,2)
    azel1 = [path1(:,k),path2(:,k)];
    x = collectPlaneWave(array,xtot,azel1,fc);
    noise = 0.1*(randn(size(x)) + 1i*randn(size(x)));
    scope(x + noise);
end
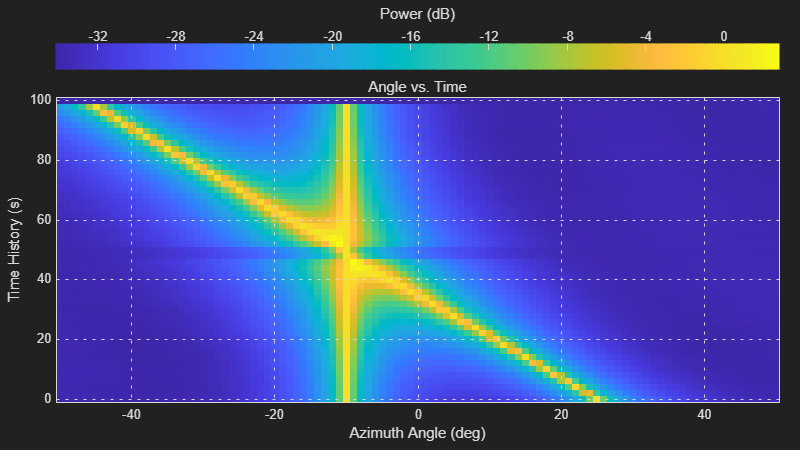
Display the directions-of-arrival (DOA) of two signals arriving at a 10-by-5 uniform rectangular array (URA).
First, create a phased.URA array System object™ composed of phased.IsotropicAntennaElement System objects.
fc = 200e6;
lambda = physconst('LightSpeed')/fc;
d = 0.45*lambda;
element = phased.IsotropicAntennaElement(FrequencyRange=[100e6,300e6]);
array = phased.URA(Element=element,Size=[5,5],ElementSpacing=[d,d]);
Then, create a phased.ATIScope System object.
scope = phased.ATIScope(IQDataInput=false, ...
    AngleLabel="Azimuth Angle (deg)", ...
    TimeSpan=100,TimeResolution=2, ...
    AngleOffset=-70);
Generate baseband signals at 300 and 400 Hz. The sampling rate of the baseband signal is 8 kHz.
fs = 8000;
t = (0:1/fs:1).';
x1 = exp(-1i*2*pi*t*300);
x2 = exp(-1i*2*pi*t*400);
Create an MVDR beamformer System object. Specify the beamformer pointing angles.
azAngle = -50:50;
elAngle = zeros(size(azAngle));
bfAngle = [azAngle;elAngle];
beamformer = phased.MVDRBeamformer(SensorArray=array, ...
    PropagationSpeed=physconst('LightSpeed'), ...
    OperatingFrequency=fc,Direction=bfAngle, ...
    WeightsOutputPort=false);
Create two of objects in azimuth-elevation space. The first path is a straight line starting at in azimuth and ending at . The second path is at a constant azimuth of degrees. Both paths have 50 samples.
path1 = [linspace(-45,25,50);zeros(1,50)];
path2 = [-10*ones(1,50);zeros(1,50)];
xtot = [x1,x2];
ymn = zeros(size(bfAngle,2));
for k = 1:size(path2,2)
    azel1 = [path1(:,k),path2(:,k)];
    x = collectPlaneWave(array,xtot,azel1,fc);
    noise = 0.1*(randn(size(x)) + 1i*randn(size(x)));
    y = beamformer(conj(x) + noise);
    ymn(k,:) = mean(abs(y),1);
    scope(ymn)
end
scope(ymn)