Main Content

spectralEntropy

Spectral entropy for signals and spectrograms

Description

se = spectralEntropy(x,f) returns the spectral entropy of the signal x over time. Specify x as a time-domain or frequency-domain signal; and f as sample rate (Hz), sample time, or frequency-vector (Hz). How the function interprets x depends on the shape of f.

example

se = spectralEntropy(x,f,t) returns the spectral entropy of the frequency-domain signal x over time, with frequency vector f and time instants t. (since R2025a)

example

se = spectralEntropy(x) returns the spectral entropy of the signal x over time. Use this syntax to specify x and obtain se as MATLAB® timetables, where x is a time-domain input signal. (since R2024b)

example

se = spectralEntropy(___,Name=Value) specifies options using one or more name-value arguments.

example

[se,tse] = spectralEntropy(___) returns the spectral entropy se along with the time vector tse. If se is a timetable, then tse is equal to the row times of the timetable se. This syntax does not apply if you set Instantaneous to false. (since R2025a)

example

spectralEntropy(___) with no output arguments plots the spectral entropy. You can specify an input combination from any of the previous syntaxes.

  • If the input is in the time domain, the function plots the spectral entropy against time.

  • If the input is in the frequency domain, the function plots the spectral entropy against frame number.

example

Examples

collapse all

Create a chirp signal with white Gaussian noise and calculate the entropy using default parameters.

fs = 1000;
t = (0:1/fs:10)';
f1 = 300;
f2 = 400;
x = chirp(t,f1,10,f2) + randn(length(t),1);

Calculate the spectral entropy from a time-domain input signal specified as a MATLAB® timetable.

tt = timetable(seconds(t),x);
entropy = spectralEntropy(tt)
entropy=311×1 timetable
       Time        SE_x  
    __________    _______

    0.0315 sec    0.87516
    0.0635 sec     0.8219
    0.0955 sec    0.82042
    0.1275 sec    0.78107
    0.1595 sec    0.80546
    0.1915 sec    0.82844
    0.2235 sec    0.74924
    0.2555 sec    0.79686
    0.2875 sec    0.88281
    0.3195 sec    0.86903
    0.3515 sec    0.81033
    0.3835 sec    0.80443
    0.4155 sec    0.79986
    0.4475 sec     0.7896
    0.4795 sec     0.8502
    0.5115 sec    0.85501
      ⋮

Plot the spectral entropy against time.

spectralEntropy(x,fs)

Figure contains an axes object. The axes object with xlabel Time (s), ylabel Entropy contains an object of type line.

Create a chirp signal with white Gaussian noise and then calculate the spectrogram using the stft function.

fs = 1000;
t = (0:1/fs:10)';
f1 = 300;
f2 = 400;
x = chirp(t,f1,10,f2) + randn(length(t),1);

[s,f] = stft(x,fs,FrequencyRange="onesided");
s = abs(s).^2;

Calculate the entropy of the spectrogram over time.

entropy = spectralEntropy(s,f);

Plot the spectral entropy against the frame number.

spectralEntropy(s,f)

Figure contains an axes object. The axes object with xlabel Frame, ylabel Entropy contains an object of type line.

Create a chirp signal with white Gaussian noise.

fs = 1000;
t = (0:1/fs:10)';
f1 = 300;
f2 = 400;
x = chirp(t,f1,10,f2) + randn(length(t),1);

Calculate the entropy of the power spectrum over time. Calculate the entropy for 50 ms Hamming windows of data with 25 ms overlap. Use the range from 62.5 Hz to fs/2 for the entropy calculation.

entropy = spectralEntropy(x,fs, ...
                      Window=hamming(round(0.05*fs)), ...
                      OverlapLength=round(0.025*fs), ...
                      Range=[62.5,fs/2]);

Plot the entropy against time.

spectralEntropy(x,fs, ...
              Window=hamming(round(0.05*fs)), ...
              OverlapLength=round(0.025*fs), ...
              Range=[62.5,fs/2])

Figure contains an axes object. The axes object with xlabel Time (s), ylabel Entropy contains an object of type line.

Since R2025a

Plot the spectral entropy of a speech signal. Visualize the spectral entropy by first creating a power spectrogram, then taking the spectral entropy of frequency bins within the bandwidth of speech.

Load the data x, which contains a two-channel recording of the word "Hello" embedded by low-level white noise. x consists of two columns representing the two channels. Use only the first channel.

Define the sample rate and the time vector. Augment the first channel of x with white noise to achieve a signal-to-noise ratio of about 5 to 1.

load Hello x
Fs = 44100;
t = 1/Fs*(0:length(x)-1);
x1 = x(:,1) + 0.01*randn(length(x),1);

Calculate the spectral entropy of the input signal x1. Plot the signal and the spectral entropy.

[se,te] = spectralEntropy(x1,Fs);

tiledlayout flow
nexttile
plot(t,x1)
xlabel("Time (seconds)")
ylabel("Speech Signal")
nexttile
plot(te,se)
xlabel("Time (seconds)")
ylabel("Spectral Entropy")

Figure contains 2 axes objects. Axes object 1 with xlabel Time (seconds), ylabel Speech Signal contains an object of type line. Axes object 2 with xlabel Time (seconds), ylabel Spectral Entropy contains an object of type line.

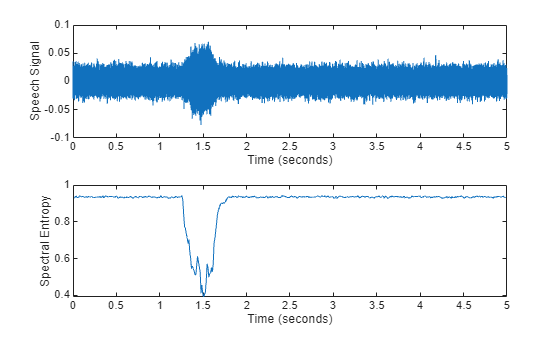
The spectral entropy drops when "Hello" is spoken. This is because the signal spectrum has changed from almost a constant (white noise) to the distribution of a human voice. The human-voice distribution contains more information and has lower spectral entropy.

Compute the power spectrogram p of the original signal, returning frequency vector fp and time vector tp as well. For this case, specifying a frequency resolution of 20 Hz provides acceptable clarity in the result.

[p,fp,tp] = pspectrum(x1,Fs,"spectrogram",FrequencyResolution=20);

The frequency vector of the power spectrogram goes to 22,050 Hz, but the range of interest with respect to speech is limited to the telephony bandwidth of 300–3400 Hz. Divide the data into five frequency bins by defining start and end points, and compute the spectral entropy for each bin.

flow = [300 628 1064 1634 2394];
fup = [627 1060 1633 2393 3400];

se2 = zeros(length(flow),size(p,2));
for i = 1:length(flow)
    se2(i,:) = spectralEntropy(p,fp,tp,Range=[flow(i) fup(i)]);
end

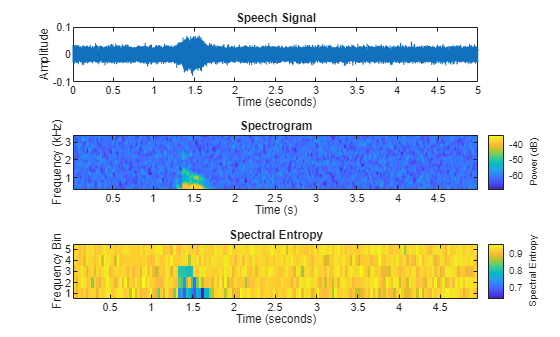
Plot the speech signal in the time domain, the signal spectrogram, and the spectral entropy over time with ascending frequency bins. The drop in spectral entropy occurs due to the speech signal, at time instants between 1.3 and 1.7 seconds, and at frequencies up to 3 kHz.

figure
tiledlayout vertical
nexttile
plot(t,x1)
xlabel("Time (seconds)")
ylabel("Amplitude")
title("Speech Signal")
nexttile
pspectrum(x1,Fs,"spectrogram",FrequencyLimits=[300 3400]);
title("Spectrogram")
nexttile
imagesc(tp,[],flip(se2))
h = colorbar(gca,"EastOutside");
ylabel(h,"Spectral Entropy")
yticks(1:5)
set(gca,YTickLabel=num2str((5:-1:1).'))
xlabel("Time (seconds)")
ylabel("Frequency Bin")
title("Spectral Entropy")

Figure contains 3 axes objects. Axes object 1 with title Speech Signal, xlabel Time (seconds), ylabel Amplitude contains an object of type line. Axes object 2 with title Spectrogram, xlabel Time (s), ylabel Frequency (kHz) contains an object of type image. Axes object 3 with title Spectral Entropy, xlabel Time (seconds), ylabel Frequency Bin contains an object of type image.

Since R2025a

Generate a sinusoidal signal surrounded by noise and use spectral entropy to detect the existence and position of the sine wave.

Generate and plot the signal, which contains three segments. The middle segment contains the sine wave along with white noise. The other two segments are pure white noise.

fs = 100;
t = 0:1/fs:10;
sin_wave = 2*sin(2*pi*20*t')+randn(length(t),1);
x = [randn(1000,1);sin_wave;randn(1000,1)];
t3 = 0:1/fs:30;

plot(t3,x)
title("Sine Wave in White Noise")
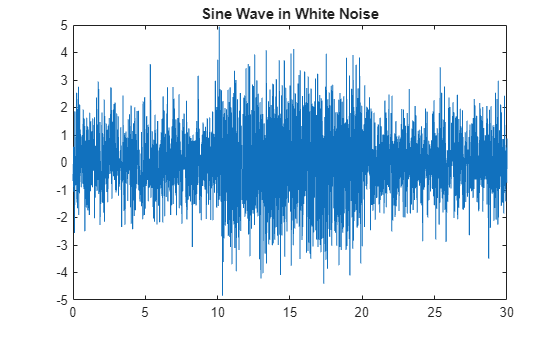
Figure contains an axes object. The axes object with title Sine Wave in White Noise contains an object of type line.

Plot the spectral entropy.

spectralEntropy(x,fs)
title("Spectral Entropy of Sine Wave in White Noise")

Figure contains an axes object. The axes object with title Spectral Entropy of Sine Wave in White Noise, xlabel Time (s), ylabel Entropy contains an object of type line.

The plot differentiates the segment with the sine wave from the white-noise segments. This is because the sine wave contains information and pure white noise does not.

The default for spectralEntropy is to return or plot the instantaneous spectral entropy for each time point, as the previous plot displays. 
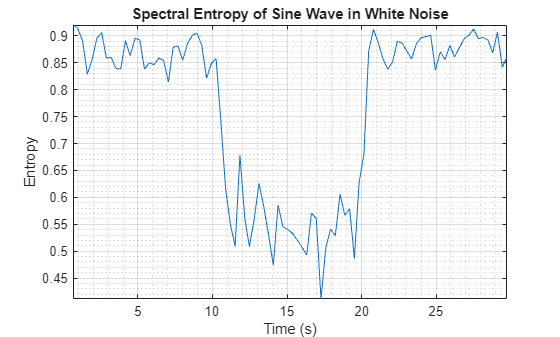
By default, spectralEntropy returns instantaneous spectral entropy for each time point, as the previous plot displays. To obtain spectral entropy value of the whole signal or spectrum as a scalar, set Instantaneous to false.

se = spectralEntropy(x,fs,Instantaneous=false)
se = 
0.8189

This value characterizes the spectral entropy, and therefore, the information content of the signal. You can use this value to efficiently compare this signal with other signals.

Input Arguments

collapse all

Input signal in the time domain or the frequency domain, specified as a vector, matrix, 3-D array, or timetable.

  • x must be real-valued.

  • How the function interprets x depends on the shape of f.

  • You can specify x as a timetable with one or more variables, and each variable can have one or more columns. If you specify x as a timetable, spectralEntropy returns se as a timetable.

For more information on signal domain specifications and valid syntaxes, see Specifications for Spectral Entropy by Signal Domain.

Data Types: single | double | timetable

Sample rate (Hz), sample time, or frequency vector (Hz), specified as a numeric scalar, duration scalar, or numeric vector, respectively. How the function interprets x depends on the shape of f:

  • If you do not specify f and x is a numeric vector or matrix, spectralEntropy assumes x is sampled at a rate equal to 1 Hz.

  • If you do not specify f and x is a timetable, spectralEntropy infers the sample rate from x.

  • If f is a numeric scalar, spectralEntropy interprets x as a time-domain signal and f as the sample rate in Hz. In this case, x must be a real-valued vector or matrix. If x as a matrix, spectralEntropy interprets the columns as individual channels.

  • If f is a duration scalar, spectralEntropy interprets x as a time-domain signal and f as the sample time. (since R2025a)

  • If f is a numeric vector, spectralEntropy interprets x as a frequency-domain signal and f as the frequency vector, in Hz, corresponding to the rows of x. In this case, x must be a real-valued L-by-M-by-N array, where L is the number of spectral values at given frequencies of f, M is the number of individual spectra, and N is the number of channels.

    The number of rows in x must be equal to the number of elements of f.

For more information on signal domain specifications and valid syntaxes, see Specifications for Spectral Entropy by Signal Domain.

Example: se = spectralEntropy(rand(5,1),10) computes the spectral entropy of a random signal in time domain at a sample frequency of 10 Hz.

Example: se = spectralEntropy(rand(5,1),seconds(10)) computes the spectral entropy of a random signal in time domain at a sample time of 10 seconds.

Example: se = spectralEntropy(rand(1024,3),0:1023) computes the spectral entropy of three 1024-sample random spectrograms with a 1024-sample frequency vector that ranges from 0 Hz to 1023 Hz.

Data Types: single | double | duration

Since R2025a

Time information for input signal in frequency domain, specified as one of these:

  • Vector of numeric, duration, or datetime time points with as many elements as columns in x.

  • duration scalar that represents the time interval between columns in the matrix x.

For more information about signal domain specifications and valid syntaxes, see Specifications for Spectral Entropy by Signal Domain.

Example: [S,F,T] = pspectrum(randn(10,1),"spectrogram"); se = spectralEntropy(S,F,T) computes the spectral entropy from a power spectrogram S at frequencies F and times T.

Data Types: single | double | duration | datetime

Name-Value Arguments

expand all

Specify optional pairs of arguments as Name1=Value1,...,NameN=ValueN, where Name is the argument name and Value is the corresponding value. Name-value arguments must appear after other arguments, but the order of the pairs does not matter.

Before R2021a, use commas to separate each name and value, and enclose Name in quotes.

Example: spectralEntropy(randn(1000,2),50,Window=hamming(256),Range=[0 10]) computes the spectral entropy of a two-channel 1000-sample random signal in time domain at a sample rate of 50 Hz, using a 256-sample Hamming window to obtain the spectrogram in the frequency range between 0 Hz and 10 Hz.

Note

If you specify other name-value arguments, spectralEntropy might ignore the specified values or error out. For more information about signal domain specifications and valid syntaxes, see Specifications for Spectral Entropy by Signal Domain.

Time Domain

expand all

Window applied in the time domain, specified as a real-valued vector. The number of elements in the vector must be in the range [1, size(x,1)]. The number of elements in the vector must also be greater than OverlapLength. If you do not specify Window, spectralEntropy uses a window length that splits x into eight overlapping segments.

Data Types: single | double

Number of samples overlapped between adjacent windows, specified as an integer in the range [0, size(Window,1)). If you do not specify OverlapLength, spectralEntropy uses a value that results in 50% overlap between segments.

Data Types: single | double

Number of bins used to calculate the DFT of windowed input samples, specified as a positive scalar integer. If unspecified, FFTLength defaults to the number of elements in the Window.

Data Types: single | double

Spectrum type, specified as "power" or "magnitude":

  • "power" –– The spectral entropy is calculated for the one-sided power spectrum.

  • "magnitude" –– The spectral entropy is calculated for the one-sided magnitude spectrum.

Data Types: char | string

Frequency-Domain

expand all

Since R2025a

Time limits, specified as a two-element vector containing the lower and upper bounds in seconds or in the same units as the sample time f. Specify the vector as one these:

  • Numeric or duration, when f is numeric or duration.

  • Numeric, duration, or datetime, when t is datetime.

Specify this argument to extract the spectral entropy from a portion of the spectrogram that corresponds to time limits. If you do not specify TimeLimits, spectralEntropy uses the entire time span of the signal or spectrogram to return the spectral entropy.

Data Types: single | double | duration | datetime

Both Domains

expand all

Frequency range in Hz, specified as a two-element row vector of increasing real values in the range [0, f/2].

Data Types: single | double

Since R2024b

Scale by white noise option, specified as a logical. Scaling by white noise — or log2n, where n is the number of frequency points — is equivalent to normalizing the spectral entropy. Scaling allows you to perform a direct comparison on signals of different length.

  • If Scaled is true, then spectralEntropy returns the spectral entropy scaled by the spectral entropy of the corresponding white noise.

  • If Scaled is false, then spectralEntropy does not scale the spectral entropy.

This argument applies if x is a time-domain signal or if x is a frequency-domain signal.

Data Types: logical

Since R2024b

Instantaneous time series option, specified as a logical.

  • If Instantaneous is true, then spectralEntropy returns the instantaneous spectral entropy as a time-series vector.

  • If Instantaneous is false, then spectralEntropy returns the spectral entropy value of the whole signal or spectrum as a scalar.

This argument applies if x is a time-domain signal or if x is a frequency-domain signal.

Data Types: logical

Output Arguments

collapse all

Spectral entropy, returned as a scalar, vector, matrix, or timetable. Each row of se corresponds to the spectral entropy of a window of x. Each column of se corresponds to an independent channel.

Since R2025a

Times associated with spectral entropy values, returned as a numeric vector, duration vector, or datetime vector.

  • If you specify x as a timetable, spectralEntropy returns tse from the Time property of the timetable se.

  • If you specify t, spectralEntropy returns tse with the same value as t.

This argument does not apply if you set Instantaneous to false.

More About

collapse all

Algorithms

The function calculates the spectral entropy as described in [5]:

entropy=k=b1b2sklog(sk)log(b2b1)

where:

  • sk is the spectral value at bin k.

  • b1 and b2 are the band edges, in bins, over which to calculate the spectral entropy.

References

[1] Pan, Y. N., J. Chen, and X. L. Li. "Spectral Entropy: A Complementary Index for Rolling Element Bearing Performance Degradation Assessment." Proceedings of the Institution of Mechanical Engineers, Part C: Journal of Mechanical Engineering Science. Vol. 223, Issue 5, 2009, pp. 1223–1231.

[2] Sharma, V., and A. Parey. "A Review of Gear Fault Diagnosis Using Various Condition Indicators." Procedia Engineering. Vol. 144, 2016, pp. 253–263.

[3] Shen, J., J. Hung, and L. Lee. "Robust Entropy-Based Endpoint Detection for Speech Recognition in Noisy Environments." ICSLP. Vol. 98, November 1998.

[4] Vakkuri, A., A. Yli‐Hankala, P. Talja, S. Mustola, H. Tolvanen‐Laakso, T. Sampson, and H. Viertiö‐Oja. "Time‐Frequency Balanced Spectral Entropy as a Measure of Anesthetic Drug Effect in Central Nervous System during Sevoflurane, Propofol, and Thiopental Anesthesia." Acta Anaesthesiologica Scandinavica. Vol. 48, Number 2, 2004, pp. 145–153.

[5] Misra, H., S. Ikbal, H. Bourlard, and H. Hermansky. "Spectral Entropy Based Feature for Robust ASR." 2004 IEEE International Conference on Acoustics, Speech, and Signal Processing.

Extended Capabilities

expand all

C/C++ Code Generation
Generate C and C++ code using MATLAB® Coder™.

GPU Arrays
Accelerate code by running on a graphics processing unit (GPU) using Parallel Computing Toolbox™.

Version History

Introduced in R2019a

expand all

See Also

| | | | (Audio Toolbox)

Topics