Time-Frequency Analysis
Signal Processing Toolbox™ provides functions and apps that enable you to visualize and compare time-frequency content of nonstationary signals. Compute the short-time Fourier transform and its inverse. Obtain sharp spectral estimates using reassignment or Fourier synchrosqueezing. Plot cross-spectrograms, Wigner-Ville distributions, and persistence spectra. Extract and track time-frequency ridges. Estimate instantaneous frequency, instantaneous bandwidth, spectral kurtosis, and spectral entropy. Perform data-adaptive time-frequency analysis using empirical or variational mode decomposition and the Hilbert-Huang transform. Explore other time-frequency representations and analysis methods using the functions and apps provided by Wavelet Toolbox™.
Apps
| Signal Analyzer | Visualize and compare multiple signals and spectra |
| Signal Labeler | Label signal attributes, regions, and points of interest |
| Signal Multiresolution Analyzer | Decompose signals into time-aligned components |
| Wavelet Time-Frequency Analyzer | Visualize scalogram of signals (Since R2022a) |
Live Editor Tasks
| Create Plot | Interactively visualize filter responses and other outputs for several signal processing functions (Since R2023a) |
Functions
Topics
- Spectrogram Computation with Signal Processing Toolbox
Compute and display spectrograms of signals using Signal Processing Toolbox functions.
- Time-Frequency Gallery
Examine the features and limitations of the time-frequency analysis functions provided by Signal Processing Toolbox.
- Practical Introduction to Time-Frequency Analysis Using the Continuous Wavelet Transform (Wavelet Toolbox)
Perform and interpret time-frequency analysis of signals using the continuous wavelet transform.
- Practical Introduction to Multiresolution Analysis (Wavelet Toolbox)
Perform and interpret basic signal multiresolution analysis (MRA).
- Wavelet Packet Harmonic Interference Removal (Wavelet Toolbox)
Use wavelet packets to remove harmonic interference from an electrocardiogram (ECG) signal. (Since R2021b)
- Pedestrian and Bicyclist Classification Using Deep Learning (Radar Toolbox)
Classify pedestrians and bicyclists based on their micro-Doppler characteristics using deep learning and time-frequency analysis.
- Radar and Communications Waveform Classification Using Deep Learning (Phased Array System Toolbox)
Classify radar and communications waveforms using the Wigner-Ville distribution (WVD) and a deep convolutional neural network (CNN).
- Spectral Descriptors (Audio Toolbox)
Overview and applications of spectral descriptors.
Related Information
- Time-Frequency Analysis (Wavelet Toolbox)
Featured Examples
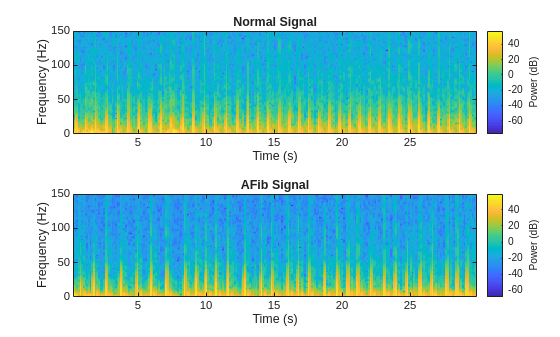
Classify ECG Signals Using Long Short-Term Memory Networks
Classify heartbeat electrocardiogram data using deep learning and signal processing.

Waveform Segmentation Using Deep Learning
Segment human electrocardiogram signals using time-frequency analysis and deep learning.
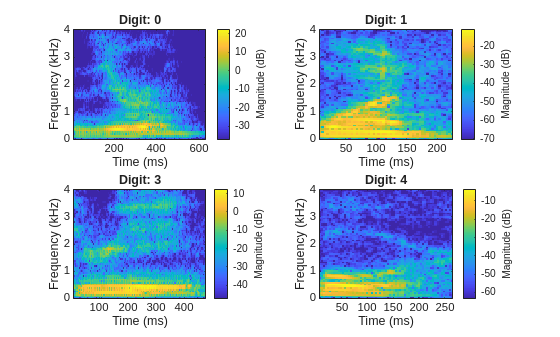
Spoken Digit Recognition with Custom Log Spectrogram Layer and Deep Learning
Classify spoken digits using a deep convolutional neural network and a custom spectrogram layer.

Signal Recovery with Differentiable Scalograms and Spectrograms
Use differentiable time-frequency transforms to recover a time-domain signal without the need for phase information or transform inversion.
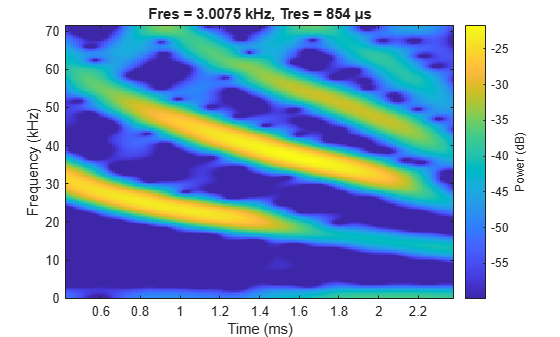
Practical Introduction to Time-Frequency Analysis
Perform and interpret basic time-frequency signal analysis of nonstationary signals.
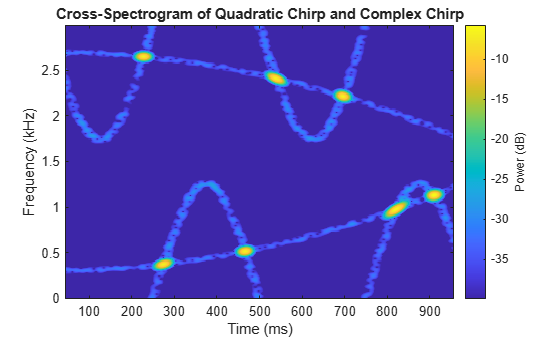
Cross-Spectrogram of Complex Signals
Highlight the regions where two signals share frequency content.
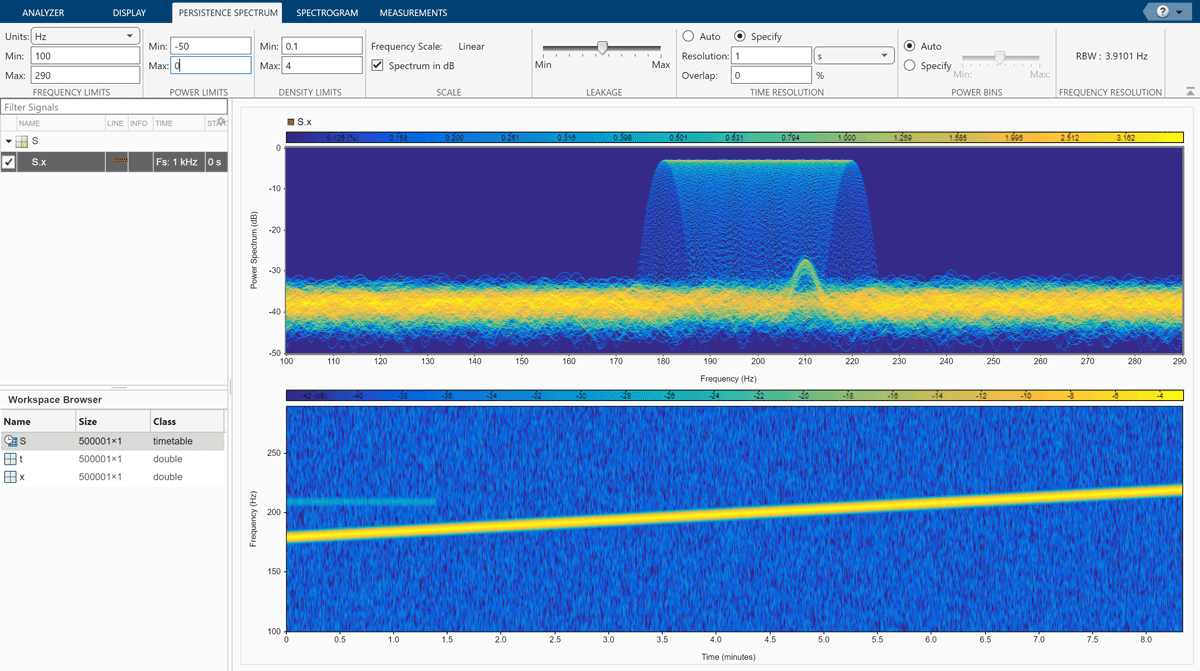
Find Interference Using Persistence Spectrum
Use the persistence spectrum in Signal Analyzer app to detect and analyze brief events.
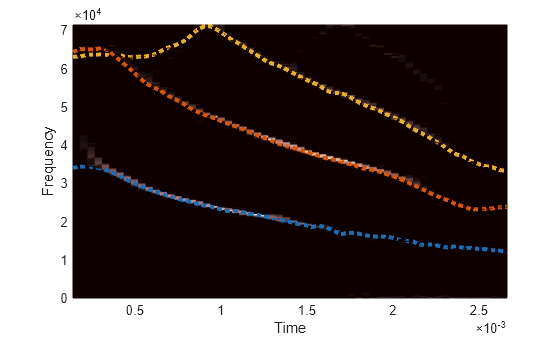
Find and Track Ridges Using Reassigned Spectrogram
Use the reassigned spectrogram in Signal Analyzer to sharpen the time and frequency localization of spectrograms.