Visualize Tuning Goals
When you tune a control system with systune or Control System
Tuner, use tuning-goal plots to visualize your design requirements against the tuned
control system responses. Tuning-goal plots show graphically where and by how much tuning
goals are satisfied or violated. This visualization lets you examine how close your control
system is to ideal performance. It can also help you identify problems with tuning and provide
clues on how to improve your design.
Tuning-Goal Plots
How you obtain tuning-goal plots depends on your work environment.
At the command line, use
viewGoal.In Control System Tuner, each tuning goal that you create generates a tuning-goal plot. When you tune the control system, these plots update to reflect the tuned design.
The form of the tuning-goal plot depends on the specific tuning goal you use.
Time-Domain Goals
For time-domain tuning goals, the tuning-goal plot is a time-domain plot of the relevant system response. The following plot, adapted from the example MIMO Control of Diesel Engine, shows a typical tuning-goal plot for a time-domain disturbance-rejection goal. The dashed lines represent the worst acceptable step response specified in the tuning goal. The solid line shows the corresponding response of the tuned system.

Frequency-Domain Goals
The plots for frequency-domain tuning goals show the target response and the tuned
response in the frequency domain. The following plot, adapted from the example Fixed-Structure Autopilot for a Passenger Jet, shows a plot for a gain goal
(TuningGoal.Gain at the command line). This tuning
goal limits the gain between a specified input and output to a frequency-dependent
profile. In the plot, the dashed line shows the gain profile specified in the tuning goal.
If the tuned system response (solid line) enters the shaded region, the tuning goal is
violated. In this case, the tuning goal is satisfied at all frequencies.

Margin Goals
For information about interpreting tuning-goal plots for stability-margin goals, see Stability Margins in Control System Tuning.
Difference Between Dashed Line and Shaded Region
With some frequency-domain tuning goals, there might be a difference between the gain profile you specify in the tuning goal, and the profile the software uses for tuning. In this case, the shaded region of the plot reflects the profile that the software uses for tuning. The gain profile you specify and the gain profile used for tuning might differ if:
You tune a control system in discrete time, but specify the gain profile in continuous time.
The software modifies the asymptotes of the specified gain profile to improve numeric stability.
Continuous-Time Gain Profile for Discrete-Time Tuning
When you tune a discrete-time control system, you can specify frequency-dependent tuning goals using discrete-time or continuous-time transfer functions. If you use a continuous-time transfer function, the tuning algorithm discretizes the transfer function before tuning. For instance, suppose that you specify a tuning goal as follows.
W = zpk([],[0 -150 -150],1125000);
Req = TuningGoal.MaxLoopGain('Xloc',W);
Suppose further that you use the tuning goal with systune to
tune a discrete-time genss model or slTuner interface. CL is
the resulting tuned control system. To examine the result, generate
a tuning-goal plot.
viewGoal(Req,CL)

The plot shows W, the continuous-time maximum
loop gain that you specified, as a dashed line. The shaded region
shows the discretized version of W that systune uses
for tuning. The discretized maximum loop gain cuts off at the Nyquist
frequency corresponding to the sample time of CL.
Near that cutoff, the shaded region diverges from the dashed line.
The plot highlights that sometimes it is preferable to specify tuning goals for discrete-time tuning using discrete-time gain profiles. In particular, specifying a discrete-time profile gives you more control over the behavior of the gain profile near the Nyquist frequency.
Modifications for Numeric Stability
When you use a tuning goal with a frequency-dependent specification, the tuning algorithm uses a frequency-weighting function to compute the normalized value of the tuning goal. This weighting function is derived from the gain profile that you specify. For numeric tractability, weighting functions must be stable and proper. For numeric stability, their dynamics must be in the same frequency range as the control system dynamics. For these reasons, the software might adjust the specified gain profile to eliminate undesirable low-frequency or high-frequency dynamics or asymptotes. The process of modifying the tuning goal for better numeric conditioning is called regularization.
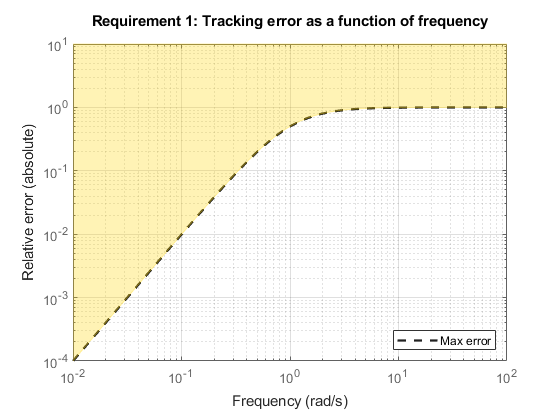
For example, consider the following tracking goal.
R1 = TuningGoal.Tracking('r','y',tf([1 0 0],[1 2 1]));
viewGoal(R1)

Here, the control bandwidth is about 1 rad/s and the gain profile has two zeros at s = 0,
which become unstable poles in the weighting function (see TuningGoal.Tracking for details). The regularization moves these zeros to about
0.01 rad/s, and the maximum tracking error levels off at about
10–3 (0.1%). If you need better tracking accuracy, you can
explicitly specify the cutoff frequency in the error profile.
R2 = TuningGoal.Tracking('r','y',tf([1 0 5e-8],[1 2 1]));
viewGoal(R2)
ylim([1e-4,10])
However, for numeric safety, the regularized weighting function always levels off at very low and very high frequencies, regardless of the specified gain profile.
Access the Regularized Functions
When you are working at the command line, you can obtain the
regularized gain profile using the getWeight or getWeights commands.
For details, see the reference pages for the individual tuning goals
for which the tuning algorithm performs regularization:
In Control System Tuner, you cannot view the regularized weighting functions
directly. Instead, use the tuning-goal commands to generate an equivalent tuning goal, and
use getWeight or getWeights to access the
regularized functions.
Improve Tuning Results
If the tuning results do not adequately meet your design requirements, adjust your set of tuning goals to improve the results. For example:
Designate tuning goals that are must-have requirements as hard goals. Or, relax tuning goals that are not absolute requirements by designating them as soft goals.
Limit the frequency range in which frequency-domain goals are enforced.
In Control System Tuner, use the Enforce goal in frequency range field of the tuning goal dialog box.
At the command line, use the
Focusproperty of theTuningGoalobject.
If the tuning results do satisfy your design requirements, you can validate the tuned control system as described in Validate Tuned Control System.