predict
Predict responses for new observations from linear incremental learning model
Syntax
Description
[ also returns classification scores for all classes when label,score] = predict(___)Mdl is an incremental learning model for classification, using any of the input argument combinations in the previous syntaxes.
Examples
Load the human activity data set.
load humanactivityFor details on the data set, enter Description at the command line.
Responses can be one of five classes: Sitting, Standing, Walking, Running, or Dancing. Dichotomize the response by identifying whether the subject is moving (actid > 2).
Y = actid > 2;
Fit a linear classification model to the entire data set.
TTMdl = fitclinear(feat,Y)
TTMdl =
  ClassificationLinear
      ResponseName: 'Y'
        ClassNames: [0 1]
    ScoreTransform: 'none'
              Beta: [60×1 double]
              Bias: -0.2005
            Lambda: 4.1537e-05
           Learner: 'svm'


  Properties, Methods
TTMdl is a ClassificationLinear model object representing a traditionally trained linear classification model.
Convert the traditionally trained linear classification model to a binary classification linear model for incremental learning.
IncrementalMdl = incrementalLearner(TTMdl)
IncrementalMdl =
  incrementalClassificationLinear

            IsWarm: 1
           Metrics: [1×2 table]
        ClassNames: [0 1]
    ScoreTransform: 'none'
              Beta: [60×1 double]
              Bias: -0.2005
           Learner: 'svm'


  Properties, Methods
IncrementalMdl is an incrementalClassificationLinear model object prepared for incremental learning using SVM.
The
incrementalLearnerfunction initializes the incremental learner by passing learned coefficients to it, along with other informationTTMdllearned from the training data.IncrementalMdlis warm (IsWarmis1), which means that incremental learning functions can start tracking performance metrics.The
incrementalLearnerconfigures the model to be trained using the adaptive scale-invariant solver, whereasfitclineartrainedTTMdlusing the BFGS solver.
An incremental learner created from converting a traditionally trained model can generate predictions without further processing.
Predict class labels for all observations using both models.
ttlabels = predict(TTMdl,feat);
illables = predict(IncrementalMdl,feat);
sameLabels = sum(ttlabels ~= illables) == 0
sameLabels = logical
   1
Both models predict the same labels for each observation.
If you orient the observations along the columns of the predictor data matrix, you can experience an efficiency boost during incremental learning.
Load and shuffle the 2015 NYC housing data set. For more details on the data, see NYC Open Data.
load NYCHousing2015

rng(1) % For reproducibility
n = size(NYCHousing2015,1);
shuffidx = randsample(n,n);
NYCHousing2015 = NYCHousing2015(shuffidx,:);
Extract the response variable SALEPRICE from the table. Apply the log transform to SALEPRICE.
Y = log(NYCHousing2015.SALEPRICE + 1); % Add 1 to avoid log of 0
NYCHousing2015.SALEPRICE = [];
Create dummy variable matrices from the categorical predictors.
catvars = ["BOROUGH" "BUILDINGCLASSCATEGORY" "NEIGHBORHOOD"];
dumvarstbl = varfun(@(x)dummyvar(categorical(x)),NYCHousing2015,...
    'InputVariables',catvars);
dumvarmat = table2array(dumvarstbl);
NYCHousing2015(:,catvars) = [];
Treat all other numeric variables in the table as linear predictors of sales price. Concatenate the matrix of dummy variables to the rest of the predictor data, and transpose the data to speed up computations.
idxnum = varfun(@isnumeric,NYCHousing2015,'OutputFormat','uniform');
X = [dumvarmat NYCHousing2015{:,idxnum}]';
Configure a linear regression model for incremental learning with no estimation period.
Mdl = incrementalRegressionLinear('Learner','leastsquares','EstimationPeriod',0);
Mdl is an incrementalRegressionLinear model object.
Perform incremental learning and prediction by following this procedure for each iteration:
Simulate a data stream by processing a chunk of 100 observations at a time.
Fit the model to the incoming chunk of data. Specify that the observations are oriented along the columns of the data. Overwrite the previous incremental model with the new model.
Predict responses using the fitted model and the incoming chunk of data. Specify that the observations are oriented along the columns of the data.
% Preallocation
numObsPerChunk = 100;
n = numel(Y);
nchunk = floor(n/numObsPerChunk);
r = nan(n,1);

figure
h = plot(r);
h.YDataSource = 'r';
ylabel('Residuals')
xlabel('Iteration')

% Incremental fitting
for j = 2:nchunk
    ibegin = min(n,numObsPerChunk*(j-1) + 1);
    iend   = min(n,numObsPerChunk*j);
    idx = ibegin:iend;
    Mdl = fit(Mdl,X(:,idx),Y(idx),'ObservationsIn','columns');
    yhat = predict(Mdl,X(:,idx),'ObservationsIn','columns');
    r(idx) = Y(idx) - yhat;
    refreshdata
    drawnow
end
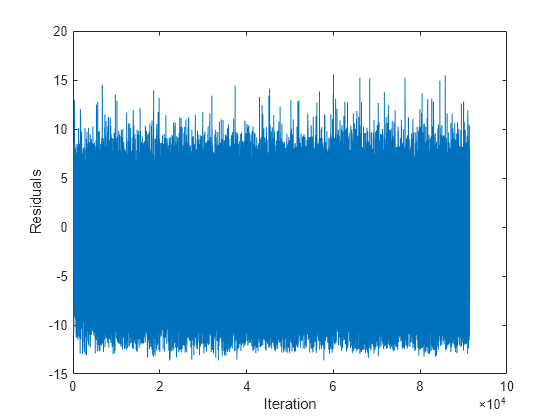
Mdl is an incrementalRegressionLinear model object trained on all the data in the stream.
The residuals appear symmetrically spread around 0 throughout incremental learning.
To compute posterior class probabilities, specify a logistic regression incremental learner.
Load the human activity data set. Randomly shuffle the data.
load humanactivity
n = numel(actid);
rng(10); % For reproducibility
idx = randsample(n,n);
X = feat(idx,:);
Y = actid(idx);
For details on the data set, enter Description at the command line.
Responses can be one of five classes: Sitting, Standing, Walking, Running, or Dancing. Dichotomize the response by identifying whether the subject is moving (actid > 2).
Y = Y > 2;
Create an incremental logistic regression model for binary classification. Prepare it for predict by specifying the class names and arbitrary coefficient and bias values.
p = size(X,2);
Beta = randn(p,1);
Bias = randn(1);
Mdl = incrementalClassificationLinear('Learner','logistic','Beta',Beta,...
    'Bias',Bias,'ClassNames',unique(Y));
Mdl is an incrementalClassificationLinear model. All its properties are read-only. Instead of specifying arbitrary values, you can take either of these actions to prepare the model:
Train a logistic regression model for binary classification using
fitclinearon a subset of the data (if available), and then convert the model to an incremental learner by usingincrementalLearner.Incrementally fit
Mdlto data by usingfit.
Simulate a data stream, and perform the following actions on each incoming chunk of 50 observations.
Call
predictto predict classification scores for the observations in the incoming chunk of data. The classification scores are posterior class probabilities for logistic regression learners.Call
rocmetricsto compute the area under the ROC curve (AUC) using the incoming chunk of data, and store the result.Call
fitto fit the model to the incoming chunk. Overwrite the previous incremental model with a new one fitted to the incoming observations.
numObsPerChunk = 50;
nchunk = floor(n/numObsPerChunk);
auc = zeros(nchunk,1);

% Incremental learning
for j = 1:nchunk
    ibegin = min(n,numObsPerChunk*(j-1) + 1);
    iend   = min(n,numObsPerChunk*j);
    idx = ibegin:iend;
    [~,posteriorProb] = predict(Mdl,X(idx,:));
    rocObj = rocmetrics(Y(idx),posteriorProb,Mdl.ClassNames);
    auc(j) = rocObj.AUC(1);
    Mdl = fit(Mdl,X(idx,:),Y(idx));
end
Mdl is an incrementalClassificationLinear model object trained on all the data in the stream.
Plot the AUC on the incoming chunks of data.
plot(auc)
ylabel('AUC')
xlabel('Iteration')
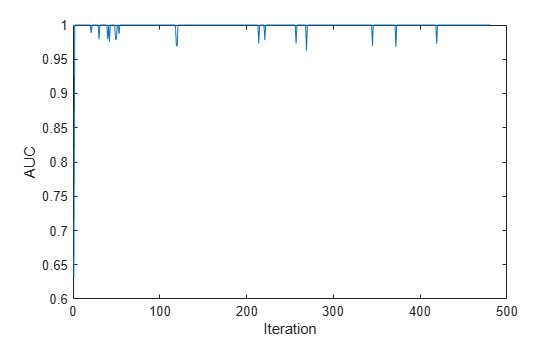
The plot suggests that the classifier predicts moving subjects well during incremental learning.
Input Arguments
Output Arguments
More About
Extended Capabilities
Version History
Introduced in R2020b