Main Content

updateMetricsAndFit

Update performance metrics in linear incremental learning model given new data and train model

Since R2020b

Description

Given streaming data, updateMetricsAndFit first evaluates the performance of a configured incremental learning model for linear regression (incrementalRegressionLinear object) or linear binary classification (incrementalClassificationLinear object) by calling updateMetrics on incoming data. Then updateMetricsAndFit fits the model to that data by calling fit. In other words, updateMetricsAndFit performs prequential evaluation because it treats each incoming chunk of data as a test set, and tracks performance metrics measured cumulatively and over a specified window [1].

updateMetricsAndFit provides a simple way to update model performance metrics and train the model on each chunk of data. Alternatively, you can perform the operations separately by calling updateMetrics and then fit, which allows for more flexibility (for example, you can decide whether you need to train the model based on its performance on a chunk of data).

example

Mdl = updateMetricsAndFit(Mdl,X,Y) returns an incremental learning model Mdl, which is the input incremental learning model Mdl with the following modifications:

  1. updateMetricsAndFit measures the model performance on the incoming predictor and response data, X and Y respectively. When the input model is warm (Mdl.IsWarm is true), updateMetricsAndFit overwrites previously computed metrics, stored in the Metrics property, with the new values. Otherwise, updateMetricsAndFit stores NaN values in Metrics instead.

  2. updateMetricsAndFit fits the modified model to the incoming data by following this procedure:

    1. Initialize the solver with the configurations and linear model coefficient and bias estimates of the input model Mdl.

    2. Fit the model to the data, and store the updated coefficient estimates and configurations in the output model Mdl.

The input and output models have the same data type.

example

Mdl = updateMetricsAndFit(Mdl,X,Y,Name,Value) uses additional options specified by one or more name-value pair arguments. For example, you can specify that the columns of the predictor data matrix correspond to observations, and set observation weights.

Examples

collapse all

Create a default incremental linear SVM model for binary classification.

Mdl = incrementalClassificationLinear()
Mdl = 
  incrementalClassificationLinear

            IsWarm: 0
           Metrics: [1x2 table]
        ClassNames: [1x0 double]
    ScoreTransform: 'none'
              Beta: [0x1 double]
              Bias: 0
           Learner: 'svm'


Mdl is an incrementalClassificationLinear model object. All its properties are read-only.

Mdl must be fit to data before you can use it to perform any other operations.

Load the human activity data set. Randomly shuffle the data.

load humanactivity
n = numel(actid);
rng(1) % For reproducibility
idx = randsample(n,n);
X = feat(idx,:);
Y = actid(idx);

For details on the data set, enter Description at the command line.

Responses can be one of five classes: Sitting, Standing, Walking, Running, or Dancing. Dichotomize the response by identifying whether the subject is moving (actid > 2).

Y = Y > 2;

Fit the incremental model to the training data by using the updateMetricsAndFit function. At each iteration:

  • Simulate a data stream by processing a chunk of 50 observations.

  • Overwrite the previous incremental model with a new one fitted to the incoming observations.

  • Store β1, the cumulative metrics, and the window metrics to see how they evolve during incremental learning.

% Preallocation
numObsPerChunk = 50;
nchunk = floor(n/numObsPerChunk);
ce = array2table(zeros(nchunk,2),'VariableNames',["Cumulative" "Window"]);
beta1 = zeros(nchunk,1);    

% Incremental fitting
for j = 1:nchunk
    ibegin = min(n,numObsPerChunk*(j-1) + 1);
    iend   = min(n,numObsPerChunk*j);
    idx = ibegin:iend;    
    Mdl = updateMetricsAndFit(Mdl,X(idx,:),Y(idx));
    ce{j,:} = Mdl.Metrics{"ClassificationError",:};
    beta1(j + 1) = Mdl.Beta(1);
end

Mdl is an incrementalClassificationLinear model object trained on all the data in the stream. During incremental learning and after the model is warmed up, updateMetricsAndFit checks the performance of the model on the incoming observations, and then fits the model to those observations.

To see how the performance metrics and β1 evolve during training, plot them on separate tiles.

t = tiledlayout(2,1);
nexttile
plot(beta1)
ylabel('\beta_1')
xlim([0 nchunk])
nexttile
h = plot(ce.Variables);
xlim([0 nchunk])
ylabel('Classification Error')
xline((Mdl.EstimationPeriod + Mdl.MetricsWarmupPeriod)/numObsPerChunk,'g-.')
legend(h,ce.Properties.VariableNames)
xlabel(t,'Iteration')

Figure contains 2 axes objects. Axes object 1 with ylabel \beta_1 contains an object of type line. Axes object 2 with ylabel Classification Error contains 3 objects of type line, constantline. These objects represent Cumulative, Window.

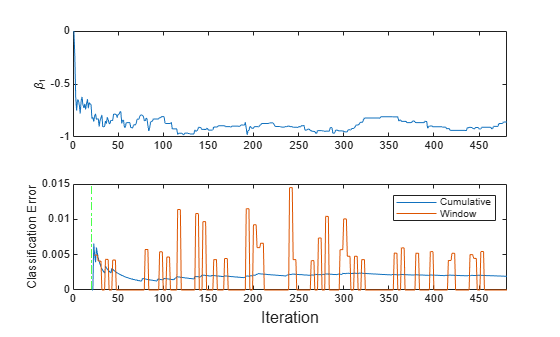
The plot suggests that updateMetricsAndFit does the following:

  • Fit β1 during all incremental learning iterations.

  • Compute the performance metrics after the metrics warm-up period only.

  • Compute the cumulative metrics during each iteration.

  • Compute the window metrics after processing 200 observations (4 iterations).

Train a linear regression model by using fitrlinear, convert it to an incremental learner, track its performance, and fit it to streaming data. Carry over training options from traditional to incremental learning.

Load and Preprocess Data

Load the 2015 NYC housing data set, and shuffle the data. For more details on the data, see NYC Open Data.

load NYCHousing2015
rng(1) % For reproducibility
n = size(NYCHousing2015,1);
idxshuff = randsample(n,n);
NYCHousing2015 = NYCHousing2015(idxshuff,:);

Suppose that the data collected from Manhattan (BOROUGH = 1) was collected using a new method that doubles its quality. Create a weight variable that attributes 2 to observations collected from Manhattan, and 1 to all other observations.

n = size(NYCHousing2015,1);
NYCHousing2015.W = ones(n,1) + (NYCHousing2015.BOROUGH == 1);

Extract the response variable SALEPRICE from the table. For numerical stability, scale SALEPRICE by 1e6.

Y = NYCHousing2015.SALEPRICE/1e6;
NYCHousing2015.SALEPRICE = [];

Create dummy variable matrices from the categorical predictors.

catvars = ["BOROUGH" "BUILDINGCLASSCATEGORY" "NEIGHBORHOOD"];
dumvarstbl = varfun(@(x)dummyvar(categorical(x)),NYCHousing2015, ...
    'InputVariables',catvars);
dumvarmat = table2array(dumvarstbl);
NYCHousing2015(:,catvars) = [];

Treat all other numeric variables in the table as linear predictors of sales price. Concatenate the matrix of dummy variables to the rest of the predictor data. Transpose the resulting predictor matrix.

idxnum = varfun(@isnumeric,NYCHousing2015,'OutputFormat','uniform');
X = [dumvarmat NYCHousing2015{:,idxnum}]';

Train Linear Regression Model

Fit a linear regression model to a random sample of half the data.

idxtt = randsample([true false],n,true);
TTMdl = fitrlinear(X(:,idxtt),Y(idxtt),'ObservationsIn','columns', ...
    'Weights',NYCHousing2015.W(idxtt))
TTMdl = 
  RegressionLinear
         ResponseName: 'Y'
    ResponseTransform: 'none'
                 Beta: [313x1 double]
                 Bias: 0.1116
               Lambda: 2.1977e-05
              Learner: 'svm'


TTMdl is a RegressionLinear model object representing a traditionally trained linear regression model.

Convert Trained Model

Convert the traditionally trained linear regression model to a linear regression model for incremental learning.

IncrementalMdl = incrementalLearner(TTMdl)
IncrementalMdl = 
  incrementalRegressionLinear

               IsWarm: 1
              Metrics: [1x2 table]
    ResponseTransform: 'none'
                 Beta: [313x1 double]
                 Bias: 0.1116
              Learner: 'svm'


Track Performance Metrics and Fit Model

Perform incremental learning on the rest of the data by using the updateMetricsAndFit function. At each iteration:

  1. Simulate a data stream by processing a chunk of 500 observations.

  2. Call updateMetricsAndFit to update the cumulative and window epsilon insensitive loss of the model given the incoming chunk of observations, and then fit the model to the data. Overwrite the previous incremental model with a new one. Specify that the observations are oriented in columns, and specify the observation weights.

  3. Store the losses and last estimated coefficient β313.

% Preallocation
idxil = ~idxtt;
nil = sum(idxil);
numObsPerChunk = 500;
nchunk = floor(nil/numObsPerChunk);
ei = array2table(zeros(nchunk,2),'VariableNames',["Cumulative" "Window"]);
beta313 = [IncrementalMdl.Beta(end); zeros(nchunk,1)];
Xil = X(:,idxil);
Yil = Y(idxil);
Wil = NYCHousing2015.W(idxil);

% Incremental fitting
for j = 1:nchunk
    ibegin = min(nil,numObsPerChunk*(j-1) + 1);
    iend   = min(nil,numObsPerChunk*j);
    idx = ibegin:iend;
    IncrementalMdl = updateMetricsAndFit(IncrementalMdl,Xil(:,idx),Yil(idx), ...
        'ObservationsIn','columns','Weights',Wil(idx));
    ei{j,:} = IncrementalMdl.Metrics{"EpsilonInsensitiveLoss",:};
    beta313(j+1) = IncrementalMdl.Beta(end);
end

IncrementalMdl is an incrementalRegressionLinear model object trained on all the data in the stream.

Plot a trace plot of the performance metrics and estimated coefficient β313.

t = tiledlayout(2,1);
nexttile
h = plot(ei.Variables);
xlim([0 nchunk])
ylabel('Epsilon Insensitive Loss')
legend(h,ei.Properties.VariableNames)
nexttile
plot(beta313)
ylabel('\beta_{313}')
xlim([0 nchunk])
xlabel(t,'Iteration')

Figure contains 2 axes objects. Axes object 1 with ylabel Epsilon Insensitive Loss contains 2 objects of type line. These objects represent Cumulative, Window. Axes object 2 with ylabel \beta_{313} contains an object of type line.

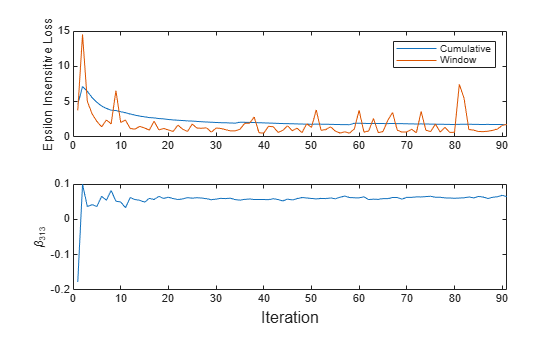
The cumulative loss gradually changes with each iteration (chunk of 500 observations), whereas the window loss jumps. Because the metrics window is 200 by default, updateMetricsAndFit measures the performance based on the latest 200 observations in each 500 observation chunk.

β313 changes, but levels off quickly, as fit processes chunks of observations.

Input Arguments

collapse all

Incremental learning model whose performance is measured and then the model is fit to data, specified as an incrementalClassificationLinear or incrementalRegressionLinear model object. You can create Mdl directly or by converting a supported, traditionally trained machine learning model using the incrementalLearner function. For more details, see the corresponding reference page.

If Mdl.IsWarm is false, updateMetricsAndFit does not track the performance of the model. For more details, see Performance Metrics.

Chunk of predictor data with which to measure the model performance and then to fit the model to, specified as a floating-point matrix of n observations and Mdl.NumPredictors predictor variables. The value of the ObservationsIn name-value argument determines the orientation of the variables and observations. The default ObservationsIn value is "rows", which indicates that observations in the predictor data are oriented along the rows of X.

The length of the observation labels Y and the number of observations in X must be equal; Y(j) is the label of observation j (row or column) in X.

Note

  • If Mdl.NumPredictors = 0, updateMetricsAndFit infers the number of predictors from X, and sets the corresponding property of the output model. Otherwise, if the number of predictor variables in the streaming data changes from Mdl.NumPredictors, updateMetricsAndFit issues an error.

  • updateMetricsAndFit supports only floating-point input predictor data. If your input data includes categorical data, you must prepare an encoded version of the categorical data. Use dummyvar to convert each categorical variable to a numeric matrix of dummy variables. Then, concatenate all dummy variable matrices and any other numeric predictors. For more details, see Dummy Variables.

Data Types: single | double

Chunk of responses (or labels) with which to measure the model performance and then fit the model to, specified as a categorical, character, or string array, logical or floating-point vector, or cell array of character vectors for classification problems; or a floating-point vector for regression problems.

The length of the observation labels Y and the number of observations in X must be equal; Y(j) is the label of observation j (row or column) in X.

For classification problems:

  • updateMetricsAndFit supports binary classification only.

  • When the ClassNames property of the input model Mdl is nonempty, the following conditions apply:

    • If Y contains a label that is not a member of Mdl.ClassNames, updateMetricsAndFit issues an error.

    • The data type of Y and Mdl.ClassNames must be the same.

Data Types: char | string | cell | categorical | logical | single | double

Note

  • If an observation (predictor or label) or weight contains at least one missing (NaN) value, updateMetricsAndFit ignores the observation. Consequently, updateMetricsAndFit uses fewer than n observations to compute the model performance and create an updated model, where n is the number of observations in X.

  • The chunk size n and the stochastic gradient descent (SGD) hyperparameter mini-batch size (Mdl.BatchSize) can be different values, and n does not have to be an exact multiple of the mini-batch size. If n < Mdl.BatchSize, updateMetricsAndFit uses the n available observations when it applies SGD. If n > Mdl.BatchSize, the function updates the model with a mini-batch of the specified size multiple times, and then uses the rest of the observations for the last mini-batch. The number of observations for the last mini-batch can be smaller than Mdl.BatchSize.

Name-Value Arguments

Specify optional pairs of arguments as Name1=Value1,...,NameN=ValueN, where Name is the argument name and Value is the corresponding value. Name-value arguments must appear after other arguments, but the order of the pairs does not matter.

Before R2021a, use commas to separate each name and value, and enclose Name in quotes.

Example: 'ObservationsIn','columns','Weights',W specifies that the columns of the predictor matrix correspond to observations, and the vector W contains observation weights to apply during incremental learning.

Predictor data observation dimension, specified as the comma-separated pair consisting of 'ObservationsIn' and 'columns' or 'rows'.

Data Types: char | string

Chunk of observation weights, specified as the comma-separated pair consisting of 'Weights' and a floating-point vector of positive values. updateMetricsAndFit weighs the observations in X with the corresponding values in Weights. The size of Weights must equal n, which is the number of observations in X.

By default, Weights is ones(n,1).

For more details, including normalization schemes, see Observation Weights.

Data Types: double | single

Output Arguments

collapse all

Updated incremental learning model, returned as an incremental learning model object of the same data type as the input model Mdl, either incrementalClassificationLinear or incrementalRegressionLinear.

When you call updateMetricsAndFit, the following conditions apply:

  • If the model is not warm, updateMetricsAndFit does not compute performance metrics. As a result, the Metrics property of Mdl remains completely composed of NaN values. For more details, see Performance Metrics.

  • If Mdl.EstimationPeriod > 0, updateMetricsAndFit estimates hyperparameters using the first Mdl.EstimationPeriod observations passed to it; the function does not train the input model using that data. However, if an incoming chunk of n observations is greater than or equal to the number of observations remaining in the estimation period m, updateMetricsAndFit estimates hyperparameters using the first nm observations, and fits the input model to the remaining m observations. Consequently, the software updates the Beta and Bias properties, hyperparameter properties, and recordkeeping properties such as NumTrainingObservations.

For classification problems, if the ClassNames property of the input model Mdl is an empty array, updateMetricsAndFit sets the ClassNames property of the output model Mdl to unique(Y).

Algorithms

collapse all

Performance Metrics

  • updateMetricsAndFit tracks model performance metrics, specified by the row labels of the table in Mdl.Metrics, from new data when the incremental model is warm (IsWarm property is true). An incremental model is warm after an incremental fitting, like updateMetricsAndFit, fits the incremental model to Mdl.MetricsWarmupPeriod observations, which is the metrics warm-up period.

    If Mdl.EstimationPeriod > 0, updateMetricsAndFit estimates hyperparameters before fitting the model to data. Therefore, the functions must process an additional EstimationPeriod observations before the model starts the metrics warm-up period.

  • The Metrics property of the incremental model stores two forms of each performance metric as variables (columns) of a table, Cumulative and Window, with individual metrics in rows. When the incremental model is warm, updateMetricsAndFit updates the metrics at the following frequencies:

    • Cumulative — The function computes cumulative metrics since the start of model performance tracking. The function updates metrics every time you call the function and bases the calculation on the entire supplied data set.

    • Window — The function computes metrics based on all observations within a window determined by the Mdl.MetricsWindowSize property. Mdl.MetricsWindowSize also determines the frequency at which the software updates Window metrics. For example, if Mdl.MetricsWindowSize is 20, the function computes metrics based on the last 20 observations in the supplied data (X((end – 20 + 1):end,:) and Y((end – 20 + 1):end)).

      Incremental functions that track performance metrics within a window use the following process:

      1. Store a buffer of length Mdl.MetricsWindowSize for each specified metric, and store a buffer of observation weights.

      2. Populate elements of the metrics buffer with the model performance based on batches of incoming observations, and store corresponding observation weights in the weights buffer.

      3. When the buffer is filled, overwrite Mdl.Metrics.Window with the weighted average performance in the metrics window. If the buffer is overfilled when the function processes a batch of observations, the latest incoming Mdl.MetricsWindowSize observations enter the buffer, and the earliest observations are removed from the buffer. For example, suppose Mdl.MetricsWindowSize is 20, the metrics buffer has 10 values from a previously processed batch, and 15 values are incoming. To compose the length 20 window, the function uses the measurements from the 15 incoming observations and the latest 5 measurements from the previous batch.

  • The software omits an observation with a NaN prediction (score for classification and response for regression) when computing the Cumulative and Window performance metric values.

Observation Weights

For classification problems, if the prior class probability distribution is known (in other words, the prior distribution is not empirical), updateMetricsAndFit normalizes observation weights to sum to the prior class probabilities in the respective classes. This action implies that observation weights are the respective prior class probabilities by default.

For regression problems or if the prior class probability distribution is empirical, the software normalizes the specified observation weights to sum to 1 each time you call updateMetricsAndFit.

References

[1] Bifet, Albert, Ricard Gavaldá, Geoffrey Holmes, and Bernhard Pfahringer. Machine Learning for Data Streams with Practical Example in MOA. Cambridge, MA: The MIT Press, 2007.

Extended Capabilities

Version History

Introduced in R2020b