Main Content

predict

Label new data using semi-supervised graph-based classifier

Since R2020b

    Description

    example

    label = predict(Mdl,X) returns a vector of predicted class labels for the data in the table or matrix X, based on the semi-supervised graph-based classifier Mdl.

    [label,score] = predict(Mdl,X) also returns a matrix of scores indicating the likelihood that a label comes from a particular class. For each observation in X, the predicted class label corresponds to the maximum score among all classes.

    Examples

    collapse all

    Use both labeled and unlabeled data to train a SemiSupervisedGraphModel object. Label new data using the trained model.

    Randomly generate 15 observations of labeled data, with 5 observations in each of three classes.

    rng('default') % For reproducibility
    labeledX = [randn(5,2)*0.25 + ones(5,2);
                randn(5,2)*0.25 - ones(5,2);
                randn(5,2)*0.5];
    Y = [ones(5,1); ones(5,1)*2; ones(5,1)*3];

    Randomly generate 300 additional observations of unlabeled data, with 100 observations per class.

    unlabeledX = [randn(100,2)*0.25 + ones(100,2);
                  randn(100,2)*0.25 - ones(100,2);
                  randn(100,2)*0.5];

    Fit labels to the unlabeled data by using a semi-supervised graph-based method. Specify label spreading as the labeling algorithm, and use an automatically selected kernel scale factor. The function fitsemigraph returns a SemiSupervisedGraphModel object whose FittedLabels property contains the fitted labels for the unlabeled data and whose LabelScores property contains the associated label scores.

    Mdl = fitsemigraph(labeledX,Y,unlabeledX,'Method','labelspreading', ...
        'KernelScale','auto')
    Mdl = 
      SemiSupervisedGraphModel with properties:
    
                 FittedLabels: [300x1 double]
                  LabelScores: [300x3 double]
                   ClassNames: [1 2 3]
                 ResponseName: 'Y'
        CategoricalPredictors: []
                       Method: 'labelspreading'


    Randomly generate 150 observations of new data, with 50 observations per class. For the purposes of validation, keep track of the true labels for the new data.

    newX = [randn(50,2)*0.25 + ones(50,2);
            randn(50,2)*0.25 - ones(50,2);
            randn(50,2)*0.5];
    trueLabels = [ones(50,1); ones(50,1)*2; ones(50,1)*3];

    Predict the labels for the new data by using the predict function of the SemiSupervisedGraphModel object. Compare the true labels to the predicted labels by using a confusion matrix.

    predictedLabels = predict(Mdl,newX);
    confusionchart(trueLabels,predictedLabels)

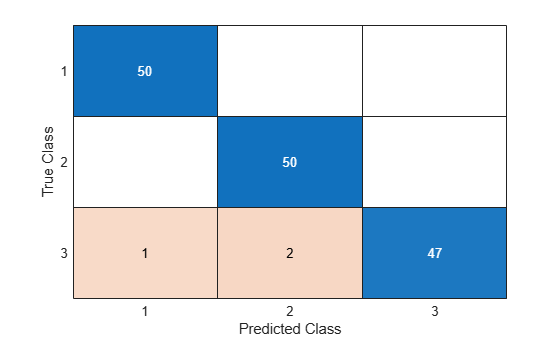
    Only 3 of the 150 observations in newX are mislabeled.

    Input Arguments

    collapse all

    Semi-supervised graph-based classifier, specified as a SemiSupervisedGraphModel object returned by fitsemigraph.

    Predictor data to be classified, specified as a numeric matrix or table. Each row of X corresponds to one observation, and each column corresponds to one variable.

    If you trained Mdl using matrix data (X and UnlabeledX in the call to fitsemigraph), then specify X as a numeric matrix.

    • The variables in the columns of X must have the same order as the predictor variables that trained Mdl.

    • The software treats the predictors in X whose indices match Mdl.CategoricalPredictors as categorical predictors.

    If you trained Mdl using tabular data (Tbl and UnlabeledTbl in the call to fitsemigraph), then specify X as a table.

    • All predictor variables in X must have the same variable names and data types as those that trained Mdl (stored in Mdl.PredictorNames). However, the column order of X does not need to correspond to the column order of Tbl. Also, Tbl and X can contain additional variables (for example, response variables), but predict ignores them.

    • predict does not support multicolumn variables, cell arrays other than cell arrays of character vectors, or ordinal categorical variables.

    If you set 'Standardize',true in fitsemigraph to train Mdl, then the software standardizes the columns of X using the corresponding means and standard deviations computed on the training data.

    Data Types: single | double | table

    Output Arguments

    collapse all

    Predicted class labels, returned as a categorical or character array, logical or numeric vector, or cell array of character vectors. label has the same data type as the fitted class labels Mdl.FittedLabels, and its length is equal to the number of rows in X.

    For more information on how predict predicts class labels, see Algorithms.

    Predicted class scores, returned as a numeric matrix. score has size m-by-K, where m is the number of observations (or rows) in X and K is the number of classes in Mdl.ClassNames.

    score(m,k) is the likelihood that observation m in X belongs to class k, where a higher score value indicates a higher likelihood.

    For more information on how predict predicts class scores, see Algorithms.

    More About

    collapse all

    Similarity Graph

    A similarity graph models the local neighborhood relationships between observations in the predictor data, both labeled and unlabeled, as an undirected graph. The nodes in the graph represent observations, and the edges, which are directionless, represent the connections between the observations.

    If the pairwise distance Disti,j between any two nodes i and j is positive (or larger than a certain threshold), then the similarity graph connects the two nodes using an edge. The edge between the two nodes is weighted by the pairwise similarity Si,j, where Si,j=exp((Disti,jσ)2), for a specified kernel scale σ value.

    Similarity Matrix

    A similarity matrix is a matrix representation of a similarity graph. The n-by-n matrix S=(Si,j)i,j=1,,n contains pairwise similarity values between connected nodes in the similarity graph. The similarity matrix of a graph is also called an adjacency matrix.

    The similarity matrix is symmetric because the edges of the similarity graph are directionless. A value of Si,j = 0 means that nodes i and j of the similarity graph are not connected.

    Algorithms

    To fit labels to unlabeled training data, fitsemigraph constructs a similarity graph with both labeled and unlabeled observations as nodes, and distributes the label information from labeled observations to unlabeled observations by using either label propagation or label spreading. The resulting SemiSupervisedGraphModel object stores the fitted labels and label scores for the unlabeled data in its FittedLabels and LabelScores properties, respectively.

    To predict the label of a new observation x, the predict function uses a weighted average of neighboring observation scores to compute the label scores for x, namely Fx=j=1nS(x,xj)Fxjj=1nS(x,xj).

    • n is the number of observations in the training data.

    • Fxj is the row vector of label scores for the training observation xj (or node j). For more information on the computation of label scores for training observations, see Algorithms.

    • S(x,xj) is the pairwise similarity between the new observation x and the training observation xj, where S(xi,xj) = Si,j is as defined in Similarity Graph.

    The column with the maximum score in Fx corresponds to the predicted class label for x. For more information, see [1].

    References

    [1] Delalleau, Olivier, Yoshua Bengio, and Nicolas Le Roux. “Efficient Non-Parametric Function Induction in Semi-Supervised Learning.” Proceedings of the Tenth International Workshop on Artificial Intelligence and Statistics. 2005.

    Version History

    Introduced in R2020b