Simulate Noncollaborative Coexistence of WLAN, Bluetooth LE, and Bluetooth BR/EDR Networks
This example shows how to simulate noncollaborative coexistence of WLAN, Bluetooth® low energy (LE), and Bluetooth basic rate/enhanced data rate (BR/EDR) networks.
Using this example, you can:
Create and configure a noncollaborative coexistence scenario consisting of a WLAN basic service set (BSS), Bluetooth LE piconet, and Bluetooth BR/EDR piconet.
Add a custom path loss model.
Capture the in-phase and quadrature (IQ) samples for all nodes.
Simulate and analyze the performance of each node.
Visualize the packet communication in the time and frequency domains for all the nodes.
Additionally, you can use this example script to perform these tasks.
Noncollaborative Coexistence Scenario
You can mitigate the interference between WLAN and Bluetooth by using two types of coexistence mechanisms: noncollaborative and collaborative. Noncollaborative coexistence mechanisms do not exchange information between two wireless networks. Collaborative coexistence mechanisms collaborate and exchange network-related information between two wireless networks. For more information about coexistence between WLAN and Bluetooth, see Bluetooth-WLAN Coexistence.
This figure shows the coexistence scenario that this example simulates.
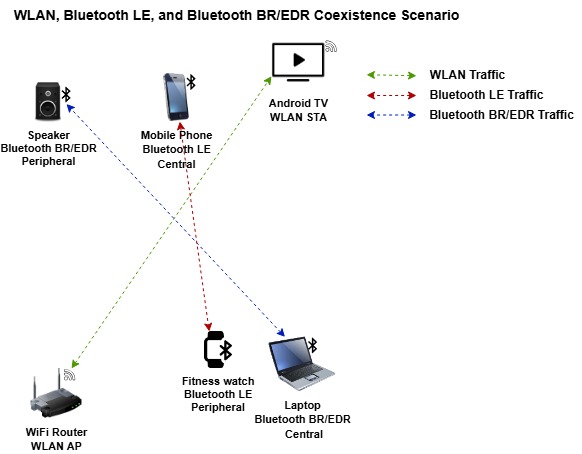
The scenario consists of these networks in an office environment. The office environment is configured by using a custom office path loss model [7].
WLAN BSS consisting of a WiFi® Router (WLAN AP) and an Android® TV (WLAN STA).
Bluetooth LE piconet consisting of a mobile phone (Bluetooth LE Central node) and a fitness watch (Bluetooth LE Peripheral node).
Bluetooth BR/EDR piconet consisting of a laptop (Bluetooth BR/EDR Central node) and a speaker (Bluetooth BR/EDR Peripheral node).
Create and Configure Scenario
Set the seed for the random number generator to 1 to ensure the repeatability of results. The seed value controls the pattern of random number generation. Initializing the random number generator using the same seed assures the same result. To improve the accuracy of your simulation results, after running the simulation, you can change the seed value, run the simulation again, and average the results over multiple simulations.
rng(1,"twister")Create a wireless network simulator object.
networkSimulator = wirelessNetworkSimulator.init;
Specify the simulation time in seconds.
simulationTime = 0.5;
WLAN BSS
To enable the WLAN BSS, set enableWLANNetwork to true.
enableWLANNetwork =  true;
true;Specify the operating frequency band, in GHz, and the channel number.
if enableWLANNetwork
    bandAndChannel = [2.4 7];
Create a WLAN device configuration for an access point (AP) and a station (STA) by using the wlanDeviceConfig object. Set the properties of the AP and STA device configurations.
    apDeviceConfig = wlanDeviceConfig( ...
        Mode="AP", ...
        BandAndChannel=bandAndChannel, ...
        TransmitPower=20, ...                                   % In dBm
        InterferenceModeling="overlapping-adjacent-channel");

    staDeviceConfig = wlanDeviceConfig( ...
        Mode="STA", ...
        BandAndChannel=bandAndChannel, ...
        TransmitPower=20, ...                                   % In dBm
        InterferenceModeling="overlapping-adjacent-channel");
From the specified configuration, create an AP and an STA node by using the wlanNode object. Specify the names and positions of the nodes. Enable the full MAC and full PHY at both the AP and STA.
    wlanAPNode = wlanNode(DeviceConfig=apDeviceConfig, ...
        Name="WLAN AP", ...
        Position=[0 1 3], ...                                  % x-, y-, and z-coordinates in meters
        MACModel="full-mac", ...
        PHYModel="full-phy");

    wlanSTANode = wlanNode(DeviceConfig=staDeviceConfig, ...
        Name="WLAN STA", ...
        Position=[2.5 2 2], ...                                % x-, y-, and z-coordinates in meters
        MACModel="full-mac", ...
        PHYModel="full-phy");
Associate the STA to the AP node.
associateStations(wlanAPNode,wlanSTANode,BandAndChannel=bandAndChannel);
Create a networkTrafficOnOff (Wireless Network Toolbox) object to generate an On-Off application traffic pattern. Configure the On-Off application traffic pattern by specifying the application data rate, packet size, and on state duration. Add application traffic between the AP and STA nodes.
    trafficSourceWLAN = networkTrafficOnOff( ...
        OnTime=Inf, ...                          % In seconds
        OffTime=0, ...
        DataRate=35000, ...                      % In Kbps
        PacketSize=200);                         % In bytes
    addTrafficSource(wlanAPNode,trafficSourceWLAN,DestinationNode=wlanSTANode);
    addTrafficSource(wlanSTANode,trafficSourceWLAN,DestinationNode=wlanAPNode);
Add the WLAN nodes to the network simulator.
    wlanNodes = [wlanAPNode wlanSTANode];
    addNodes(networkSimulator,wlanNodes)
end
Bluetooth LE Piconet
To enable the Bluetooth LE network, set enableBluetoothLENetwork to true.
enableBluetoothLENetwork =  true;
true;Create a Bluetooth LE node, specifying the role as "central". Specify the name and position of the Central node.
if enableBluetoothLENetwork
    centralLENode = bluetoothLENode("central", ...
        Name="Central LE", ...
        Position=[2 2 1], ...                      % x-, y-, and z-coordinates in meters
        TransmitterPower=0);                       % In dBm
Create a Bluetooth LE node, specifying the role as "peripheral". Specify the name and position of the Peripheral node.
    peripheralLENode = bluetoothLENode("peripheral", ...
        Name="Peripheral LE", ...
        Position=[1 1 1], ...                            % x-, y-, and z-coordinates in meters
        TransmitterPower=0);                             % In dBm
Create a default Bluetooth LE connection configuration object. Set the connection interval and active period. For each connection interval, the LE node triggers the connection events throughout the simulation. The active period is the active communication period within each connection interval, after which the connection event ends. Assign the configuration to the Central and Peripheral nodes.
    connectionConfig = bluetoothLEConnectionConfig( ...
        ConnectionInterval=0.01, ...                                     % In seconds
        ActivePeriod=0.01);                                              % In seconds
    configureConnection(connectionConfig,centralLENode,peripheralLENode);
Create a networkTrafficOnOff (Wireless Network Toolbox) object to generate an On-Off application traffic pattern. Configure the On-Off application traffic pattern by specifying the application data rate, packet size, and on state duration. Add application traffic between the Central and the Peripheral nodes.
    trafficSourceLE = networkTrafficOnOff(...
        OnTime=Inf,OffTime=0, ...
        DataRate=350,PacketSize=20);
    addTrafficSource(centralLENode,trafficSourceLE, ...
        DestinationNode=peripheralLENode)
    addTrafficSource(peripheralLENode,trafficSourceLE, ...
        DestinationNode=centralLENode)
Add the Bluetooth LE nodes to the wireless network simulator.
    bluetoothLENodes = [centralLENode peripheralLENode];
    addNodes(networkSimulator,bluetoothLENodes)
end
Bluetooth BR/EDR Piconet
To enable the Bluetooth BR/EDR network, set enableBluetoothBREDRNetwork to true.
enableBluetoothBREDRNetwork =  true;
true;Create a Bluetooth BR/EDR node, specifying the role as "central". Specify the name and position of the Central node.
if enableBluetoothBREDRNetwork
    centralBREDRNode = bluetoothNode("central", ...
        Name="Central BR EDR", ...
        Position=[2 1 1]);                         % x-, y-, and z-coordinates in meters
Create a Bluetooth BR/EDR node, specifying the role as "peripheral". Specify the name and position of the Peripheral node.
    peripheralBREDRNode = bluetoothNode("peripheral", ...
        Name="Peripheral BR EDR", ...
        Position=[1 2 2]);                                % x-, y-, and z-coordinates in meters
Create and configure a Bluetooth BR/EDR connection configuration object. Assign the configuration to the Central and Peripheral nodes.
    connectionConfig = bluetoothConnectionConfig;
    connectionConfig.TransmitterPower = 0;                                      % In dBm
    configureConnection(connectionConfig,centralBREDRNode,peripheralBREDRNode);
Create a networkTrafficOnOff (Wireless Network Toolbox) object to generate an On-Off application traffic pattern. Configure the On-Off application traffic pattern by specifying the application data rate, packet size, and On-state duration. Add application traffic between the Central and the Peripheral nodes.
    trafficSourceBR = networkTrafficOnOff(...
        OnTime=Inf, OffTime=0, ...
        DataRate=200, PacketSize=27);
    addTrafficSource(centralBREDRNode,trafficSourceBR, ...
        DestinationNode=peripheralBREDRNode)
    addTrafficSource(peripheralBREDRNode,trafficSourceBR, ...
        DestinationNode=centralBREDRNode)
Add the Bluetooth BR/EDR nodes to the wireless network simulator.
    bluetoothBREDRNodes = [centralBREDRNode peripheralBREDRNode];
    addNodes(networkSimulator,bluetoothBREDRNodes)
end
Retrieve the nodes added to the wireless network simulator.
nodes = networkSimulator.Nodes;
Visualize Wireless Network
To visualize the nodes in noncollaborative coexistence network, use the wirelessNetworkViewer object. The visualization shows the node placements in the Cartesian plane. To add the nodes to the wireless network viewer, use the addNodes object function of the wirelessNetworkViewer object.
netViewerObj = wirelessNetworkViewer();
if enableWLANNetwork
    addNodes(netViewerObj,wlanNodes,Type="WLAN");
end
if enableBluetoothLENetwork
    addNodes(netViewerObj,bluetoothLENodes,Type="Bluetooth LE");
end
if enableBluetoothBREDRNetwork
    addNodes(netViewerObj,bluetoothBREDRNodes,Type="Bluetooth BREDR");
end

Add Custom Path Loss Model
To add your own custom path loss model, enable the enableCustomPathloss flag. If you set this flag to false, the example uses the free-space path loss model.
enableCustomPathloss =  true;
true;To determine the path loss between the nodes, this example uses NIST PAP02-Task 6 [7] path loss model.
Create a path loss model by using the bluetoothPathLossConfig (Bluetooth Toolbox) object and bluetoothPathLoss (Bluetooth Toolbox) function. Set the signal propagation environment to an office. The updatePathLoss function creates a path loss model function handle. Add the path loss model to the network simulator by using the addChannelModel (Wireless Network Toolbox) object function. This custom path loss model is applicable only for the 2.4 GHz frequency band.
if enableCustomPathloss
    pathlossCfg = bluetoothPathLossConfig(Environment="Office");
    pathlossHandle = @(rxInfo,txData) updatePathLoss(rxInfo,txData,pathlossCfg); % Path loss function
    addChannelModel(networkSimulator,pathlossHandle);
end
Capture IQ Samples
To capture IQ samples for all the nodes in the simulation, enable the enableIQSampleCapture flag. The receiving node captures the IQ samples based on the relevant packets received.
enableIQSampleCapture =  false;
Capture the IQ samples of the nodes by using the wirelessIQLogger object. At the end of the simulation, the simulation stores the IQ samples of the corresponding PHY in the nodes in a MAT file with the filename format NodeName_NodeID_CenterFrequency_Bandwidth_yyyyMMdd_HHmmss.mat, where:
NodeName — Name of the node.
NodeID — Numeric ID of the node.
CenterFrequency — Operating center frequency of the PHY.
Bandwidth — Operating bandwidth of the PHY.
yyyyMMdd — Date of file creation, in the format year, month, day.
HHmmss — Time of file creation, in the format hour, minute, second, using the 24-hour clock format.
A MAT file corresponding to each node stores the captured IQ samples. If the network contains several nodes or when the simulation time is long, the process of capturing the IQ samples consume significant memory. The MAT file generated at the end of the simulation can consume significant disk space. For example, a system-level simulation that captures 1000 million IQ samples creates a MAT file of approximate size 8 GB.
if enableIQSampleCapture
    for idx = 1:numel(nodes) %#ok<UNRCH>
        iqSampleFileNames(idx) = nodes{idx}.Name+"_IQSamples";
    end
    iqSampleObj = wirelessIQLogger(nodes,FileName=iqSampleFileNames);
end
Configure Packet and Node Performance Visualization
To visualize packet communication in the WLAN BSS, Bluetooth LE piconet, and Bluetooth BR/EDR piconet, set enablePacketVisualization to true. The visualization shows these plots:
Packet communication over the time and frequency domains.
State transitions of Bluetooth and WLAN packets, for each node, over time.
At the end of the simulation, you can visualize packets at any time instance.
enablePacketVisualization =  true;
true;Initialize the visualization by using the wirelessTrafficViewer object. Add the nodes to the traffic viewer by using the addNodes object function of wirelessTrafficViewer object. To display the visualization at the end of simulation, set the RefreshRate property to 0.
if enablePacketVisualization
    netViewerObj = wirelessTrafficViewer;
    addNodes(netViewerObj,nodes);
end
To view the node performance visualization, set enableNodePerformancePlot to true. The visualization displays the packet loss ratio, throughput, and latency of the WLAN, Bluetooth LE, and Bluetooth BR/EDR nodes at the end of simulation.
enableNodePerformancePlot =  true;
true;Calculate the node performance by using the helperPerformanceViewer helper object.
performancePlotObj = helperPerformanceViewer(nodes,simulationTime);
Simulation and Results
Run the simulation for the specified time and generate these results:
Runtime plot for all the nodes, showing the state transitions and packet transmissions over time and frequency domains.
Bar plot for all the nodes, showing the packet loss ratio, throughput, and average application layer (APP) packet latency. You can find these results in the
performancePlotObjvariable.APP, link layer (LL), and PHY statistics for all the simulated nodes.
run(networkSimulator,simulationTime)


The plotNetworkStats object function displays these simulation plots.
LL throughput (in Mbps) at each node.
LL packet loss ratio (ratio of unsuccessful data transmissions to the total data transmissions) at each node.
Average application packet latency (in seconds) incurred at each node.
if enableNodePerformancePlot
    plotNetworkStats(performancePlotObj)
end


Retrieve the statistics of all the nodes. For more information about WLAN node statistics, see WLAN System-Level Simulation Statistics. For more information about Bluetooth BR/EDR and LE node statistics, see Bluetooth BR/EDR Node Statistics (Bluetooth Toolbox) and Bluetooth LE Node Statistics (Bluetooth Toolbox), respectively.
nodeStats = cellfun(@(x) x.statistics,nodes,UniformOutput=false);
The packet communication visualization shows the MAC state for all the nodes in the time domain. The frequency plot shows the coexistence of Bluetooth and WLAN nodes in the 2.4 GHz frequency band. The overlapping of the packets in the time and frequency domains can result in a packet failure.
The Performance of Bluetooth Nodes bar graph shows that the Bluetooth BR/EDR packets experience more packet loss than the Bluetooth LE packets. However, the Bluetooth BR/EDR piconet has a higher throughput than the Bluetooth LE piconet. In cases of packet loss, the Bluetooth LE nodes close their connection, which results in a lower packet loss ratio. In cases of packet loss, the Bluetooth BR/EDR nodes continue to communicate with each other, which results in higher throughput. Because of Bluetooth interference impacting WLAN, the AP and STA nodes also have packet losses.
Further Exploration
You can use this example to further explore these capabilities.
Analyze Performance of Nodes by Varying any Parameter
To analyze the impact of any parameter on the performance of any node or network, perform these steps.
Vary the parameter value and run the simulation in a loop.
Retrieve and save the statistics in a variable.
Plot the required statistics.
For example, you can simulate and analyze the impact of Bluetooth LE and Bluetooth BR/EDR node transmit power on the packet loss ratio, throughput, and average packet latency of the WLAN nodes. Vary the Bluetooth node transmit power from -20 dBm to 20 dBm. The transmit power of the WLAN nodes is constant at 0 dBm. Run the simulation in a loop for a simulation time of 10 s, obtaining these results.


By disabling the Bluetooth nodes, preventing interference, you can see that the WLAN network has a throughput of 2.89 Mbps and latency of 0.14 s. You can observe that, as the transmit power of the Bluetooth nodes increases, the packet loss in the WLAN BSS also increases. Furthermore, as the packet loss increases, the throughput decreases and latency increases.
Analyze Bluetooth and WLAN MIMO Coexistence with Multipath Fading Channel
To simulate the coexistence of Bluetooth LE and WLAN multiple input multiple output (MIMO) networks, add a custom channel into the wireless network simulator by using the addChannelModel (Wireless Network Toolbox) object function of the wirelessNetworkSimulator (Wireless Network Toolbox) object. This channel facilitates communication between single input single output (SISO) and MIMO antennas. For instance, this figure shows a noncollaborative coexistence scenario that includes a Bluetooth LE piconet equipped with SISO antenna and a WLAN network equipped with MIMO antennas.

This scenario models a home environment to account for path loss and employs a custom multipath fading channel by using the helperMIMOChannel helper object. Specify the channelModel input argument of the helperBluetoothLEWLANMIMOCoexistence helper function to "MIMO" or "WLAN TGax." If you select "MIMO", the helper object configures a comm.MIMOChannel channel with Rayleigh fading, path gain, and path delays according to the "Channel-A" type channel model configuration specified in [8]. If you select "WLAN TGax", the helper object sets up a wlanTGaxChannel with a "Model-B" delay profile between the nodes [5] [6]. To see the simulation results, uncomment and run this code.
% [plrVal,throughputVal,latencyVal] = helperBluetoothLEWLANMIMOCoexistence("MIMO")Add Custom Channel Classification for Bluetooth Nodes
To add a custom channel classification algorithm to the Bluetooth nodes, perform these steps.
Create a custom channel classification object.
Create a channel classification function handle.
Classify the channels by passing the classification function at an absolute simulation time, or at a particular periodicity, by using the
scheduleAction(Wireless Network Toolbox) object function of thewirelessNetworkSimulator(Wireless Network Toolbox) object.Instead of scheduling or calling the classification at certain simulation time instances, you can implement a custom channel classification by classifying the channels based on the status of the received packets.
Update the status of the received packets, and classify the channels based on the status of the received packets. Update the used channel of the Bluetooth nodes by using the
updateChannelList(Bluetooth Toolbox) function of thebluetoothLENode(Bluetooth Toolbox) objectbluetoothNode(Bluetooth Toolbox) object.
For more information on how to add channel classification for Bluetooth nodes, see the Noncollaborative Bluetooth LE Coexistence with WLAN Signal Interference (Bluetooth Toolbox) and Bluetooth BR/EDR Data and Voice Communication with WLAN Signal Interference (Bluetooth Toolbox) examples.
You can also enable channel classification in the scenario specified in the Simulate Bluetooth and WLAN MIMO Coexistence with Multipath Fading Channel section. To enable channel classification at the Bluetooth LE nodes, specify the enableChannelClassification input argument in the helperBluetoothLEWLANMIMOCoexistence helper object to true. To see the simulation results, uncomment and run this code.
% enableChannelClassification = true;
% [plrVal,throughputVal,latencyVal] = helperBluetoothLEWLANMIMOCoexistence("MIMO",enableChannelClassification)
With channel classification enabled, you can observe that Bluetooth LE channels overlapping with WLAN are classified as bad. Consequently, performance metrics such as throughput, packet loss rate (PLR), and latency for both Bluetooth LE and WLAN improve.
Add Multiple Piconets and WLAN BSSs to the Network
For information on how to add multiple nodes or piconets to the Bluetooth network, see the Simulate Multiple Bluetooth BR/EDR Piconets with ACL Traffic (Bluetooth Toolbox) example. For information on how to add multiple nodes or BSSs to the WLAN network, see the Simulate an 802.11ax Hybrid Mesh Network example.
Visualize Captured IQ Samples
Capture the IQ samples by enabling the enableIQSampleCapture flag. To visualize the captured IQ samples, use the Signal Analyzer app. For example, to visualize the IQ samples captured at the WLAN AP, uncomment this code.
% if enableIQSampleCapture && enableWLANNetwork
%   apNodeIQSamples = load(wlanAPNode.Name+"_IQSamples"+".mat");
%   signalAnalyzer(apNodeIQSamples.Waveform);
% end
Appendix
The example uses these helpers:
helperPerformanceViewer— Return a performance metrics viewer objecthelperBluetoothLEWLANMIMOCoexistence— Simulate Noncollaborative Coexistence of Bluetooth LE and WLAN MIMOhelperMIMOChannel— Return a channel between the Bluetooth and WLAN nodes supporting SISO and MIMO communicationhelperBluetoothChannelClassification— Create an object to classify the Bluetooth LE channelshSLSTGaxMultiFrequencySystemChannel— Return a system channel objecthSLSTGaxSystemChannel— Return a channel object for full PHY layerhSLSTGaxSystemChannelBase— Return the base channel object
References
Bluetooth Technology Website. “Bluetooth Technology Website | The Official Website of Bluetooth Technology.” Accessed November 04, 2025. https://www.bluetooth.com/.
Bluetooth Core Specifications Working Group. "Bluetooth Core Specification". Version 6.0. https://www.bluetooth.com/specifications/specs/core-specification-6-0/.
Institute of Electrical and Electronics Engineers (IEEE). “IEEE Recommended Practice for Information Technology-- Local and Metropolitan Area Networks-- Specific Requirements-- Part 15.2: Coexistence of Wireless Personal Area Networks with Other Wireless Devices Operating in Unlicensed Frequency Bands.” IEEE Standard 802.15.2. IEEE, August 28, 2003. https://doi.org/10.1109/IEEESTD.2003.94386.
Institute of Electrical and Electronics Engineers (IEEE). "IEEE Standard for Information Technology--Telecommunications and Information Exchange between Systems Local and Metropolitan Area Networks--Specific Requirements Part 11: Wireless LAN Medium Access Control (MAC) and Physical Layer (PHY) Specifications Amendment 1: Enhancements for High-Efficiency WLAN." IEEE 802.11ax-2021. IEEE, May 19, 2021. https://doi.org/10.1109/IEEESTD.2021.9442429.s
Institute of Electrical and Electronics Engineers (IEEE). TGax Simulation Scenarios. IEEE 802.11-14/0980r16. IEEE, 2015.
Institute of Electrical and Electronics Engineers (IEEE). 11ax Evaluation Methodology. IEEE 802.11-14/0571r12. IEEE, January 2016.
NIST Smart Grid Interoperability Panel Priority Action Plan 2: Guidelines for Assessing Wireless Standards for Smart Grid Applications. National Institute of Standards and Technology, U.S. Department of Commerce, 2014. https://www.nist.gov/publications/nist-smart-grid-interoperability-panel-priority-action-plan-2-guidelines-assessing.
International Telecommunication Union, ITU-M Recommendation M.1225 GUIDELINES FOR EVALUATION OF RADIO TRANSMISSION TECHNOLOGIES FOR IMT-2000, Annex 2, Section 1.2.2 Channel impulse response model, Table 3 "Indoor office test environment tapped-delay-line parameters".
Local Functions
Custom Path Loss Model
Create a custom path loss model by using the bluetoothPathLoss (Bluetooth Toolbox) function, and attach it to the wireless network simulator.
function rxData = updatePathLoss(rxInfo,txData,pathlossCfg)

    % Apply path loss and update output signal
    rxData = txData;
    % Calculate distance between transmitter and receiver in meters
    distance = norm(rxData.TransmitterPosition - rxInfo.Position);
    pathloss = bluetoothPathLoss(distance,pathlossCfg);
    rxData.Power = rxData.Power-pathloss;                           % In dBm
    scale = 10.^(-pathloss/20);
    [numSamples,~] = size(rxData.Data);
    rxData.Data(1:numSamples,:) = rxData.Data(1:numSamples,:)*scale;
end
See Also
Objects
wlanNode|wirelessNetworkSimulator(Wireless Network Toolbox) |wlanDeviceConfig|bluetoothLENode(Bluetooth Toolbox) |bluetoothNode(Bluetooth Toolbox) |networkTrafficOnOff(Wireless Network Toolbox) |wirelessTrafficViewer(Wireless Network Toolbox) |wirelessNetworkEventTracer(Wireless Network Toolbox) |wirelessIQLogger(Wireless Network Toolbox) |wirelessNetworkViewer(Wireless Network Toolbox)