
Q_band_ZB_3dplot
Computes and plot the electrons distribution in the ZB Brillouin zone
You are now following this Submission
- You will see updates in your followed content feed
- You may receive emails, depending on your communication preferences
Q_band_ZB_3dplot
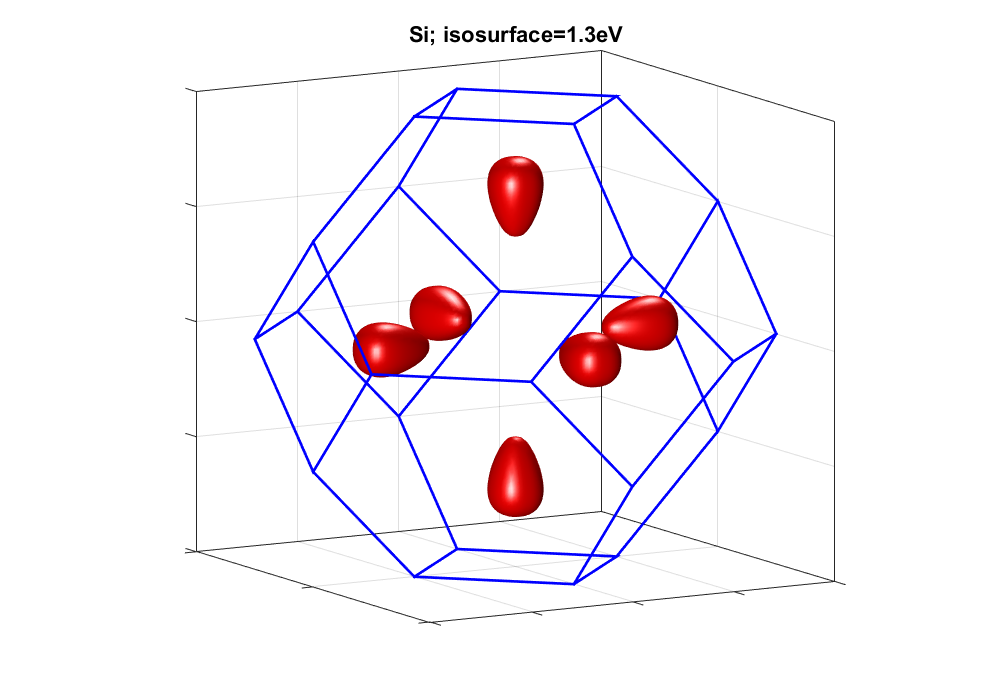
Computes and plot the electrons distribution in the ZB Brillouin zone
It uses the tight-binding model sp3s* where the parameters a from the following references:
-> for the III-V: KLIMECK et al, Superlattices and Microstructures, Vol. 27, No. 5/6, 2000
-> for Si: KLIMECK et al, Superlattices and Microstructures, Vol. 27, No. 2/3,2000
-> for Ge: VOGL et al, I. Phys. Chom. Solids Vol. 44, No. 5. pp. 365-378, 1983


Cite As
Laurent NEVOU (2026). Q_band_ZB_3dplot (https://github.com/LaurentNevou/Q_band_ZB_3dplot), GitHub. Retrieved .
General Information
- Version 1.0.1 (176 KB)
-
 View License on GitHub
MATLAB Release Compatibility
- Compatible with any release
Platform Compatibility
- Windows
- macOS
- Linux
Versions that use the GitHub default branch cannot be downloaded
| Version | Published | Release Notes | Action |
|---|---|---|---|
| 1.0.1 | image updated |
||
| 1.0.0 |
To view or report issues in this GitHub add-on, visit the GitHub Repository.
To view or report issues in this GitHub add-on, visit the GitHub Repository.