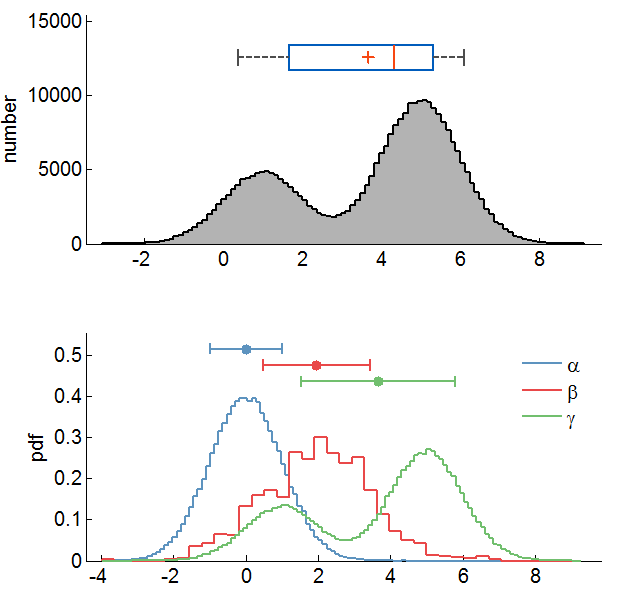
Plot and compare histograms; pretty by default
Compares multiple sets of data elegantly. Set bins and axis bounds to be appropriate for the data.

You are now following this Submission
- You will see updates in your followed content feed
- You may receive emails, depending on your communication preferences
Editor's Note: This file was selected as MATLAB Central Pick of the Week
Cite As
Jonathan C. Lansey (2026). Plot and compare histograms; pretty by default (https://au.mathworks.com/matlabcentral/fileexchange/27388-plot-and-compare-histograms-pretty-by-default), MATLAB Central File Exchange. Retrieved .
General Information
- Version 1.13.0 (23.5 KB)
MATLAB Release Compatibility
- Compatible with any release
Platform Compatibility
- Windows
- macOS
- Linux
| Version | Published | Release Notes | Action |
|---|---|---|---|
| 1.13.0 | General update with axis tweaks etc. |
||
| 1.12.0 | Officially added boxplot (box and whiskers plot) to the graphs |
||
| 1.11.0 | Fixed minor colormap issue for 'colorm' option. |
||
| 1.10.0 | Fixed the colors so that they look really great with the help of colorbrewer2.org. You also have the option to set your own colors now. |
||
| 1.9.0 | changed the name of the function to be more clear |
||
| 1.8.0 | I improved the aesthetic choice of axis bounds in cases when some of your plots have no data. |
||
| 1.7.0 | I have implemented robust handling of NaN and inf data points. Changed underscores in struct field names "_" to spaces in the titles and legends. |
||
| 1.4.0 | Expanded the function to allow data points which are infinite (in value, not in number!) |
||
| 1.3.0 | implemented ''npoints' for passing in structures. |
||
| 1.2.0 | Added an option to plot a smooth fit instead of the default stairs function (Rob' suggestion). |
||
| 1.1.0 | I forgot to include the linspecer function, sorry! |
||
| 1.0.0 |

