Breaking the Boundaries: Integrating GIS, AI, and Lidar for Digital Innovation
Hong Tran, Spacesium
A key component of the digital transformation of GIS data is the rapid integration and interrogation of large data sets, lidar point clouds, and visual information to support rapid decision making. For example, smart city automation relies on accurate knowledge of street infrastructure, such as the location and condition of utility poles and power lines, while forestry managers require canopy and trunk estimation and digital terrain mapping to enhance their operations. Significant challenges remain, including the need for rapid but accurate processing of spatial point clouds and the integration of visual and multispectral data with lidar data to provide information beyond a simple (x,y,z) location.
Traditional feature-based methods for processing point cloud data can be slow and imprecise. In some cases, such as on mine sites, feature-based algorithms may misinterpret ground profiles as buildings due to the planar shapes of spoil heaps, leading to inaccuracies. In contrast, at Spacesium we are using cutting-edge deep learning algorithms, such as R-CNN, DeepLab v3 and PointNet++, in conjunction with semi-supervised retraining, to rapidly segment and classify point clouds utilizing cloud scale resources.
The integration of visual and multispectral data presents a unique set of challenges and opportunities. While it allows for more than just the specification of the position of an xyz point cloud, using both location and visual data can enable the determination of viable routes for autonomous vehicles. On the challenge side, it is computationally expensive to fuse these data sets that are captured in separate imaging systems. At Spacesium, we have implemented custom algorithms based on tools from Image Processing Toolbox™, Computer Vision Toolbox™, and Lidar Toolbox™ to efficiently correct, compute, and fuse these data sets.
Published: 7 May 2023
[AUDIO LOGO]
Hi. My name is Hong Tran, and I'm a GIS engineer from Curtin University, Australia. I worked in the mining industry for the last 12 years as a GIS engineer and data expert, and the last five years in various startups in Australia, Israel, Japan, and the US. I recently founded a startup in Australia called Spacesium in 2022, and we're developing software to process and analyze LiDAR point clouds in conjunction with viewing all this data in an online web viewer. The topic that I'll be talking about today is Breaking the Boundaries, the Integration of GIS, AI, LiDAR for Digital Transformation.
Now, the three agendas that I'll be talking about today will primarily be on these three. The first one will be insights. Why and where LiDAR is used in GIS, their applications, and their use cases. Also, we're going to be touching on the challenges-- the challenges with processing LiDAR and the various techniques that we've used through our experience on processing large amounts of data like LiDAR point clouds.
The three sub-topics we'll talk about will be time-saving techniques for faster processing, making sure the data is as best quality as possible-- and that is removing noise, and then we're going to touch on a few techniques on labeling and processing segmentation point clouds. And then lastly, we'll start to look at why and how we're going to bring all of this together into a GIS-ready application.
Now, you guys would have seen this quote from Elon Musk quite a while, and it's been very popular lately. So, "anyone relying on LiDAR is doomed." And that's what Elon mentioned a couple of years back in 2019. Now, though I don't agree on him on all of his statements, especially on Twitter, I do agree that we cannot rely solely on LiDAR. We need to ensure that LiDAR is the core technology, but we do have vision and combinational vision with our LiDAR.
So as you can see here, all of these types of methods of capturing LiDAR-- so we have the LiDAR that's mounted on autonomous vehicles, LiDAR that's on terrestrial laser scannings-- so you can see a lot of these LiDARs throughout the construction work sites-- and recently, the ease of drones. So drones all have LiDAR on them as well, and they're starting to implement the vision on those LiDARs.
And then also on the right hand side, you can see that there's a big influx of SLAM LiDARs-- the simultaneous mapping types of LiDARs Now all these LiDARs-- also, with mobile laser scanning, they have all implemented not just the LiDAR, but they're actually putting vision sensors on them as well. So they were combining all of these sensors together with a LiDAR. It's adding a lot of value, and a lot of the LiDAR hardware vendors are starting to move into this direction because they know that we cannot solely rely on the LiDAR.
Now, this all comes into why were we using LiDAR, and what are the trends that it's moving towards? So it's recently been found out that in 2021, the market size and the trend has already gone to $6.75 billion. And then it expects by 2027 it's going to go to $54 billion, growing annually at 30%. Now that's a really, really big trend, because by 2030, we're going to have 75% of millennials in the workplace, and they are the ones that are going to be the technology adopters, the digital natives.
Now for the guys that don't know who the millennials are, they're the ones that are born between 1981 to 1996, and I'm included in that group. Now LiDAR is going to be the main data source for contributing in this big market size that is trending upwards, and what I want to do is, I want to talk about why do we want to do it? Why do we want to use LiDAR? And when is it going to be a big influential pivot in GIS and digital twins?
So we need to step back and we need to see, what is LiDAR, and how does it work? So this is a really, really quick off the corner. So LiDAR-- it means light detection and ranging. It's a remote sensing technology that uses laser lights to measure distances of 3D objects and environments. And the basic principle of it is that it uses laser pulses. It shoots the laser pulse off sensors, it gets that reflection, and then captures the time it has taken for that pulse to go and come back. And then it uses that millions and-- it gets that millions and millions of times so that it can calculate and build a 3D point cloud.
What happens is it creates a 3D environment of the object or the environment. So use cases-- mapping and environmental. The mapping guys, they need it to have accurate representation of their environments. Infrastructure and construction-- so those guys, they manage a lot of assets, and it's really vital that they use very, very accurate and easy to use point clouds and 3D representation, again, of their assets.
Mining and surveying-- so surveyors and mining, they have a lot of assets on the ground that are increasing in price. So their assets are iron ore, bauxite. Any heavy material is an asset for them, and they want to know, hey, how do we get accurate results very fast using LiDAR?
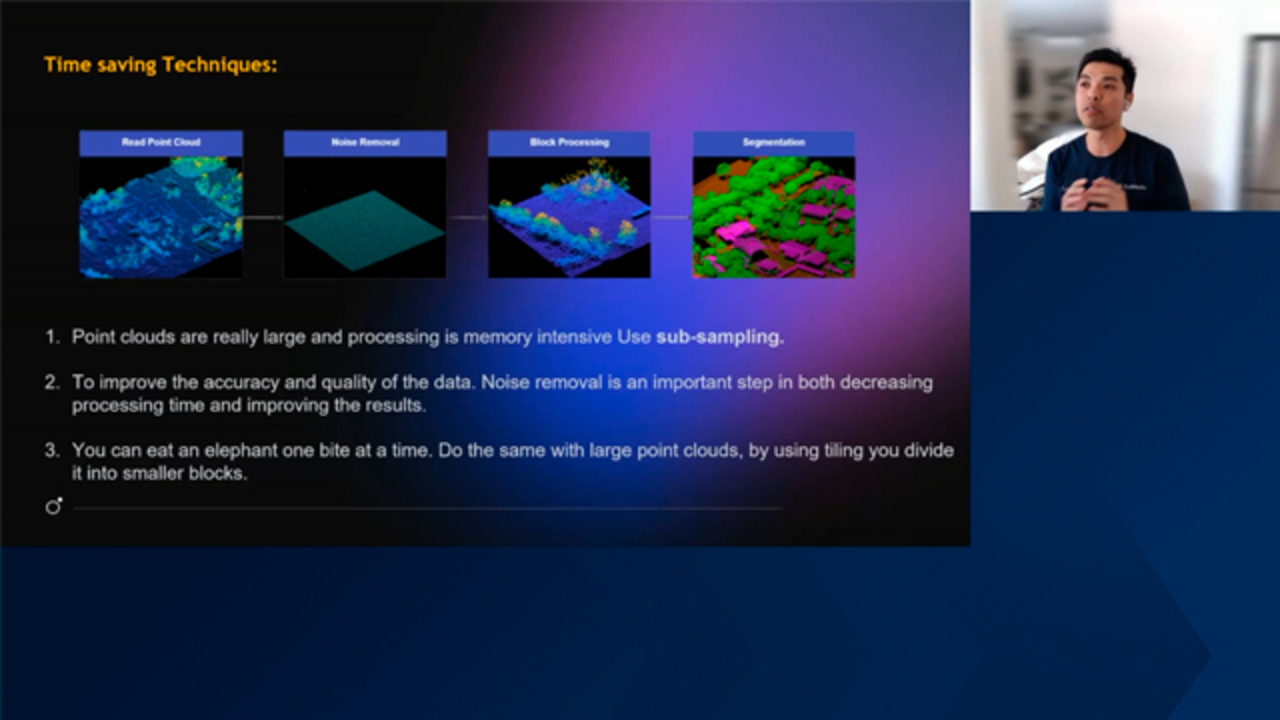
Now, this is a perfect segue to what we're going to be talking about next, and we're going to be talking about, how do we get these results? And from our experience, using MATLAB to try to get these results easier and more efficient. So from our experience in dealing with large amounts of point clouds throughout the industry and throughout the various sensors, we've developed with MATLAB four simple key takeaways for this presentation and for processing the LiDARs.
So firstly, we'll get the point cloud. Now you might think, OK, a point cloud is a small file, but actually it can range from 1 gigabyte to 10 gigabytes to 30 gigabytes to terabytes. So you could be scanning an individual site, you could be scanning a vehicle, a car, a building, or an entire city. So what we use is we use a technique called subsampling, and this is what we will discuss further on in further slides.
Now that's to improve the memory and the CPU usage. The next one will be accuracy and quality. Now that's just as important as the first point, so what we've developed is, we've developed a way where we can actually improve the quality by removing the noise. So I know it sounds pretty weird, but what we found out is, the more that you remove the rubbish and the noise out of it, the better the results come in the end.
And then the last one is processing. You cannot wait days or even weeks for a result, so what we've done is, we've made it possible where you can process very, very large point clouds by utilizing a technology in MATLAB called block processing. And what that does is, you can pretty much process really, really large data sets by breaking it down into individual tiles and running simultaneous processing on those blocks. And we're discussing that further later on.
So first technique, subsampling. Subsampling is a function in MATLAB in the LiDAR tool box called pcdownsample. And what that is is, it reduces the density of the point cloud without losing its structure. So the whole purpose of this is to make sure that we have enough CPU power to process the entire project and not crashing the program by using up all of its memory.
So, for example, if you have terabytes of data, it's going to be very, very expensive to have terabytes of RAM or even CPU power or even storage. So what we do is we break it up into a downsampled product without losing its structure. So you can see that this is the raw file here on the left and the right, but on the next slide here, we've actually downsampled it.
So what we've done is, for this example in that code there, we've downsampled the point cloud to 0.5 meters. And this is really specifically from our learnings for each individual scan. So this sensor is a UAV sensor in an urban environment. So by using 0.5 meters as a downsample, you can see on the left that the structure is still there.
You can still get the classifications of a building, you can still get it off the ground. You can still distinguish the tree, you can still distinguish a power line, and you can even still distinguish fences and cars. So the real benefit of this is that you speed up your processing, but you don't lose your structure and you keep your accuracy. It's a really, really good technique. It's a low-lying fruit. You can do it really, really efficiently, and the benefits of speed is really, really good.
Next one. So for this one is-- from our experiences, different LiDAR sensors have different results and have different types of noise. So what we've experienced is that there's a function called pcdenoise in MATLAB, and what we've done there is we figured out that we can group a cluster of points within a distance, and then we can classify them as noise.
So for this example here, we have actually found out that this is a terrestrial scanner that you put on a tripod and it spins in 360. And what happens is when the sensor hits the sky, there's a sun there, and the sun flare actually is like looking in the sun. It'll blind your eye. So what the sensor does is that it picks it up as a noise. And then you can see here just under the nearest numbers, there's a whole bunch of red points. Now, that's the noise.
If you run this simple code here, it'll pretty much eliminate 95% of that noise. It's a really, really fast way of cleaning and de-noising your point cloud. So in the end, you get a faster product, a faster processing speed, and a better quality product. It's a really, really good method and methodology of cleaning your point clouds really, really efficiently.
The whole backstory of this is, I didn't know this function when we were building an autonomous drone on various mine sites in the world, and I had to keep up with post-processing all the mine sites globally, 24/7, by manually selecting, lassoing, and deleting point clouds, and it was not fun. So this simple code was a really, really good low-lying fruit just to get quality and speed up results. So these two things could potentially save you 5 to 10x on time reduction.
The next one. So we have been processing not just small projects, but projects that involve big aerial laser scan, and even satellite LiDAR scanning. So what happens here is, because you get such a big, broad area of data sets, you really need to find a systematic way of processing these point clouds smartly. So what we've done here is-- this is a relatively new process in MATLAB, but a very, very old technique in the GIS industry where we get the point cloud, and then we segment it into various blocks.
So for this example here, we have a large area, and we break it down into individual blocks on the right hand side here. So this is a simple code. So you can see here that we cut the block size to 5. And what does that 5 mean? That 5 means that it creates a 5 by 5 meter block size, it cuts that, and then it puts that as an individual file. And we do that across the whole site.
So, why do we do this? We do this because as the technology changes in compute power, we have to build our algorithms to complement that. So what we want to do is, if we don't want to have our CPUs running with one core on one process. We want to multi-thread and run multiple instances on this whole project.
So if you break this up into 10 tiles, you have the potential of speeding the process up 10 times, because now you can run processing on each tile in parallel instead of in serial. So now you can pretty much cut your processing time by 10x and keeping the quality of the segmentation and the processing at the same time.
So we've got these three covered. I wanted to move on to the workflow, on how we do it, and how we utilize a bit of MATLAB with our code to process this. So this is the workflow. It's a segmentation. Now the segmentations that we're going to discuss here is PointNet++, and this is the workflow that we use. So you can see here, input file. So the input file, you may think, OK, that's a very easy workflow or task, but it's a very difficult task, and let me explain why.
Because we are dealing with different types of sensors on different payloads with different proprietary file formats. So if you use a terrestrial scanner, you're going to get an E57. If you're going to use a LiDAR or a SLAM, you're going to get text files in. What we do is we build transformers to get the file into industry standard.
So for this example, we get those pesky text files, we get the E57 priority files, and various other files as well, and we just put them into a PCD or a LAS file-- or a las file. And once we get into those formats, we start the workflow. We get input file. And the first thing we do in parallel is, we break that into blocks, into tiles, what we mentioned previously.
At that same time, we've already pre-trained our PointNet network on this type of scan in this type of environment, and then we get that into it. Now, once we look at [INAUDIBLE] film, we see, hey, does any of these boxes have data? If they do, great. We continue on. So what we do is we move up. We go yes. We downsample that point cloud. We already know we're going to downsample it.
We're going to remove the noise as much as possible. It doesn't matter because we're going to have the same amount-- the behavior of noise on one tile is always going to behave the same on another tile. The code is written in there, and it will all apply to the same task. And then once we have that, we'll convert the point cloud into our cell array so it's compatible for the input layer into the network so that we can move on to the classifications from PointNet.
Now, once we have the PointNet classifications and the segmentations-- that does the buildings, poles, fences, power lines, trucks, cars, vegetation, et cetera, and the ground-- we're going to get those segmentations, and now we're going to write it into the point cloud. We're going to write it into the original code into the tile.
So now we're going to have X, Y, Z, intensity RGB, and we're going to have the classifications attached to the point cloud. And then once we have all those boxed together, we're going to push it all into or merge it into the original file size again, and then we'll just have the original file size with all of its original attributes and the classifications on that.
So you're going to take-- a question is, hey, the point sample has been downsampled. Do we leave it as a downsample file? No. Actually at the end, we upsample it and we bring all the points back again so we don't lose any points. And then for the noise, we don't actually-- well, we can remove it, but what we do is we classify it as noise and we remove it from segmentation so it's much more efficient and much more faster.
So now we move on to the next results of the segmentation. So here we can see, that's the entire area. What we do is, as mentioned previously, we break it up into tiles. The tiles enable us to use multi-core and multi-batch processing. So we can spin up a 64-core machine with 128 gigabyte RAM hard drive.
And then we can run it individually on the tile, and we can run it 10 times on 10 tiles simultaneously. And what happens is, you get tiles that are--
--poles, fences, power lines, trucks, cars, vegetation, and the ground. So it's a really, really fast way of processing, and you can see in each tile that they get their individual classifications, and then they get added on to the whole big picture in the end.
So next, from all of our lessons learned from building our software with MATLAB, we found this trend-- with a lot of classifications and LiDAR processing is that a lot of people use rule-based, which is really good, it's really fast, and then they manually classify it. They QA/QC it in the end, and it's a great way of testing it and proving that their product is OK to work with.
However, with our experiences with using PointNet Net and various other machine learning and AI, it's very difficult to develop AI and machine learning on individual environments. You have to really develop it on a set of environments with a set of sensors, and then you can start to move from there. Because it is really, really hard, and it's really, really-- you've got to use a lot of high effort to re-code based on the left-hand side, the environment, because the earth is a very complex place, so there's very different environments.
And then with the technology coming up in the middle, there's going to be a lot of new sensors. I mean, sensors are going to get better, yes. But there's going to be a lot of different sensors with different formats. We have to keep up with that, and we have to build cost software to actually work with those different combinations. So in the end, you get algorithms for the different hardware plus the environment. So eventually, yes, we're going to get all those libraries and put them together so it works efficiently, but for now we have to baby steps and keep it really simple.
So in summary-- we're coming into the end here, so-- well, we found out that there is no one key solution for all of this. There is no magic button that you can just ChatGPT it or sam it and then it just gives you a perfect output. It may get there, but for our experience in the last five years, it's a very, very difficult and steep learning curve. So what we've done is, we actually kept it really simple. We found out that machine learning and AI can consume a lot of compute power.
And compute power is not just local now, it's cloud-based. And cloud-based is extremely costly if you don't do the simple work. It's going to be a hybrid approach. If you make it really complex, you're going to make it into a black box, and that's what we don't want. Because if you're not happy with the result, it's going to be really difficult to find out why those results are once you black-box everything and you don't understand how everything works.
So from our experience, we like to work with industry experts, the main experts. They're the ones that have been out in the field. They're the ones that know, hey, this is what a tree looks like, even though we know what it looks like. This is how our power line acts, this is how this infrastructure performs. And then what we do is, we get these findings from the industry experts and then we apply it to code. So they don't have to know about-- they don't have to do it all again. We do all the hard work for them, and then we integrate that into the best function that can perform.
So with all of this theory, as discussed previously, we don't really get into, hey, where does this go into? What are the outcomes that come from all of our learnings and all of our software development? So I would just like to show you outcomes that we've worked with from the last couple of years where we've processed a lot of use cases with a lot of partnership vendors to get the outcomes that we have for those use cases.
So the first one here is forestry and carbon. So it might look like a random RGB point cloud here, but what it actually is is, the left hand side is the raw point cloud. That's what it looks like intensity. It just looks black and white, gray. So what we do is, we go to the customer and they say, hey, can you count the trees and find the heights of the trees? Sure, we can do that.
So what we do is we develop the code so that they can do the scan, we can run it through the code, through the software. And then what we do is, we'll output a text file and this point cloud saying that, hey, there's this amount of trees-- average height. This is the height of every tree, this is the xy point of the tree, and this is the canopy diameter of each tree, systematically, done consistently. They can measure, they can capture, they can do everything that they need to do. That's for the environment and forestry guys.
The next one, power lines and infrastructure. This was one of the key benefits of LiDAR for a few of our projects in Japan and Australia. So what they want to know is, hey, where is the power lines close to vegetation? Because we need to send our maintenance guys to prevent the trees from hitting the power lines when the power line swings and sags.
So what we've done is instead of a field crew going out and walking and driving the power line for kilometers and kilometers, we'll get a drone over or a airplane over, scan the whole power line site, run our code, and then now they can visually-- can see, hey, this is a power line, this is the proximity of vegetation. If there's a potential swing in or sag in the power lines, this is the forecast of what's going to happen. These power lines are going to hit these trees. So let's get sent out a report, and then they go send the field crew out without even going out to site and inspecting it manually.
Disaster management, insurance management. I mean, LiDAR has a really, really good technology where you can not see through objects, but you can penetrate objects with low density. So for this example on the right hand side, they want to know what the structure of the mountain is so that they can pre-plan and forecast if there's going to be any earthquakes or landslides in this area.
So we can develop algorithms to strip away the vegetation and then give the contours or the surface to a geotechnical engineer or asset manager, and they can forecast what are the impacts if this does happen without even going to site. They can actually do this all using software. Really powerful.
Earth moving and stockpile management in the mining industries. This is one of my pains. So what happens here is, we have a drone flying over a commodity. So the commodity for this example is iron ore and bauxite. So in the next decade, I'm not predicting it, but commodities are going to be harder to get, which thus makes it more expensive and more valuable. So what this case is, is mine managers and mine operators want to know how much assets are on the ground.
So what we do here on the left-hand side is, we classify all the infrastructure, all the vegetation, all the noise so that the right-hand side is given to the surveyor, and they can calculate instantly how much asset's on the ground instantly, confidently. So that's a really good use case.
Last one-- flood management. This is a really good one as well. A lot of natural disasters, a lot of flooding. So what this does is, it can classify all the trees, all the vegetation, all the buildings, and then run hydrology analysis, see where the pooling is, see where the water flows are, where the next infrastructure build needs to be and tem plane. So it's a really, really good way of planning for urban infrastructure and flood management.
So this is coming to the end. I tried to make this as practical as possible, so thank you very much for sticking till the end. I really encourage you guys to click on our LinkedIn page and keep to date on our journey. Thank you.
[AUDIO LOGO]
Featured Product
Lidar Toolbox
Up Next:

Related Videos:


Select a Web Site
Choose a web site to get translated content where available and see local events and offers. Based on your location, we recommend that you select: United States.
You can also select a web site from the following list
Americas
- América Latina (Español)
- Canada (English)
- United States (English)
Europe
- Belgium (English)
- Denmark (English)
- Deutschland (Deutsch)
- España (Español)
- Finland (English)
- France (Français)
- Ireland (English)
- Italia (Italiano)
- Luxembourg (English)
- Netherlands (English)
- Norway (English)
- Österreich (Deutsch)
- Portugal (English)
- Sweden (English)
- Switzerland
- United Kingdom (English)