Modeling Radar and Wireless Coexistence - MATLAB & Simulink
Video Player is loading.
Current Time 0:00
Duration 22:04
Loaded: 0.74%
Stream Type LIVE
Remaining Time 22:04
 
1x
  • Chapters
  • descriptions off, selected
  • en (Main), selected
    Video length is 22:04

    Modeling Radar and Wireless Coexistence

    Congestion in the radio frequency (RF) spectrum and increasing demand for RF bandwidth has resulted in sharing the spectrum between different RF users, including radar systems and wireless communication systems. The coexistence between radar and communication systems generates some unwanted effects such as interference or blockage. By understanding these effects, proper mitigation techniques can be developed to ensure satisfactory performance of the two systems.

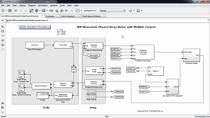
    See how to model a scenario with a radar system and a wireless communication system working in the same environment and using the same spectrum. Assess the possible radar performance degradation and evaluate different mitigation techniques.

    Learn how to:

    • Model a radar system in the vicinity of a wireless communication system, including RF and antenna subsystems, waveform designs, and a realistic propagation environment
    • ·Generate IQ signal at the radar receiver due to the target reflection and broadcasted wireless communication signal
    • ·Sense and identify received waveforms; apply beamforming techniques to avoid or minimize interference effects

    Published: 31 May 2022

    [AUDIO LOGO]

    Hello. And welcome to our talk on Modeling Radar and Wireless Coexistence. Before we dive in, let me introduce myself. My name is Kirsten McCane, and I am an Aerospace and Defense Industry Manager at MathWorks in Washington DC. I've been with MathWorks for a little over a year now. Prior to MathWorks, I spent 12 years leading Development and Management of Radar Software Applications for Northrop Grumman.

    I'd also like to take a moment to ask that if you share about the Expo on social media, to please use the hashtag #MATLABEXPO, as shown here. Also, connect with me and get updates on topics like this by following me on LinkedIn.

    Now, in the United States, 5G services launched in 46 markets on January 19, 2022 using frequencies and a radio spectrum called the C-band. These frequencies can be close to those used by radio altimeters, which is an important piece of safety equipment in aircraft.

    This launch follows years of discussions, analysis, and delays between government and industry over exactly how 5G would affect airport radar operations and safety, given the factors of US airspace and regulations. The reason I share this example is because overlap and congestion of applications in the art spectrum is increasing, and having the ability to understand the complexity and effects of this problem space will be critical to the successful operation and safety of these applications as we move forward.

    Today, we were going to share with you some different modeling strategies that I hope will help your organization navigate and succeed through these emerging challenges. We're going to explore three main topics today. First, I'll talk about the challenging landscape of the arcs of our spectrum.

    Then, Babak will cover some of the modeling techniques for this coexistence scenario. Finally, Giorgia will talk about how you can perform some analysis and simulation to allow you to assess our performance and possible mitigation. Let's get started.

    So let's begin by taking a closer look at the increasing congestion we are seeing in the RF spectrum due to modern applications. We start by looking at how 5G applications are driving new data rate and efficiency requirements. In this space, we see 5G applications around ultra, high-resolution video, VR, and connected devices which drive challenging requirements, like enhanced mobile broadband. To meet these requirements, technical solutions center around the need for increased bandwidth and better spectral efficiency, which has resulted in 5G communication's movement into higher-frequency bands.

    Now, that movement to higher frequencies has not come without challenges. We see propagation challenges around items like signal attenuation, wideband performance, and the ability to deal with scatter-rich environments between transmitters and receivers. We need modeling and simulation in these areas to perform analysis to gain a better understanding of their effects.

    And these communication systems, at higher operating frequencies, are expanding to also overlap with radar bands that are performing a multitude of operations that are critical to our safety in everyday life. These include capabilities around surveillance, tracking, and providing other critical information our systems use to navigate and make decisions within their environment. And this creates a real challenge in terms of interference, just like the interference between the 5G base station and radar altimeter that I mentioned earlier.

    The good news is that to address these challenges, we can use signal-level and power-level analysis to help with the planning for either understanding the interference effects or by coming up with mitigation techniques to avoid the side effects of the interference. And that is what my colleagues will discuss today. So I will now bring in my colleague Babak to discuss the scenario modeling you can perform for the radar and wireless coexistence use case I just described.

    Thank you, Kirsten. And hello, everyone. My name is Babak Memarzadeh. I'm the Product Manager for Radar Toolbars at MathWorks. My background is in electromagnetics. I have a PhD from Northeastern University. And before joining MathWorks, I worked for a ground-penetrating radar company for about seven years, where I gained a lot of experience working with radars.

    Today, I'd like to talk about scenario modeling for the coexistence of radar and wireless systems and show you a workflow that you can use to not only understand the challenges that this coexistence brings with itself, but also evaluate and assess the mitigation techniques that you might have in mind. OK, let's get started.

    A typical radar scenario modeling workflow starts with modeling the targets and platforms. Here, our platform is the radar altimeter, and our target is the surface of the ground. In the radar scenario, we can model land and sea surfaces. By importing a Digital Terrain Elevation Data, or a DTED file, we can model the land elevation height map. And then, we can assign a radar reflectivity model to that surface to generate radar returns.

    The next step is to model the trajectory either by defining waypoints or using kinematic properties to model the trajectory. Here, we are modeling a landing trajectory of a flight at O'Hare International Airport. The next step is to model the sensors and ultimately simulate the scenario.

    To model the radar altimeter sensor, we can get the specifications from a recommendation by ITU on operational characteristics of radar altimeters. By having a center frequency, PRF, and chirp bandwidth, we can model the FMCW waveform for the radar. By knowing the transmitter power, we can model the radar transmitter. And the antenna gain, an antenna beam width will help us to model an antenna for both radiating and collecting elements of the radar altimeter.

    And then, we model the radar receiver with its noise figure with a linear model. Ultimately, they encapsulate all these models into one system object radar transceiver, which will allow us to generate IQ signal in a very simple syntax of code. I'll show you in a second.

    OK. Now, we have everything to simulate the scenario and generate IQ signal. As I mentioned, with this simple syntax of code, as you can see here, we can generate an IQ signal and then pass this IQ signal to our signal processing algorithm. Here, we are applying the dechirp on the signal. And then, we integrate it over the pulses. And then, we find the beat frequency by rootmusic function, and then translate that beat frequency to a range, which, here, is our MeasuredAltitude.

    As you advance the scene, we are advancing the time in our scenario. And as the time is advancing, the platforms are moving through the trajectory, as you can see on the bottom left here. On the top right, we are looking at the range response of this radar altimeter. And we can see that as the radar altimeter is getting closer to the surface of the ground, the range response is decreasing, as expected.

    Now, we can also compare the output of this model with the ground truth. When we look at these pictures of the radar altimeters, we see that the accuracy limits of the radar altimeter is a function of the altitude, as shown with the green area here. These accuracy margins get tighter and tighter as the altitude decreases, which makes a lot of sense.

    Here, we can see with the blue line that all the measured altitudes with this model are within the accuracy limits. So we can be assured that our model is functional. The next step is to bring in the interference into this scenario and model the coexistence of the two systems.

    When we look at the Google Map, we notice that there are five different locations for base stations close to this flight path that we are modeling. To model the base stations close to the flight path, we need to model their waveform, their antenna array, and also the propagation channel. For the waveform, we can generate a 5G signal with the wireless waveform generator app. This is a very simple GUI that allows someone like me that doesn't have that much experience with 5G to specify minimal parameters and generate the desired signal and then export that signal into a MATLAB script which allows me to call that function as necessary within my model.

    Then, we model base station antenna with NR rectangular panel array, which is described in the 3GPP documents. With this system object, you can model sub arrays to generate the beam pattern that you desire. In our case, because we want to model the worst-case scenario, we model one 8-by-8 antenna array to maximize the directivity in one direction.

    The next step is to simulate radar and interference signal propagation. For the radar, we assume a two-wave propagation channel in free space. And for the interference signal or the communications signal, we assume a one-wave propagation channel in free space to capture the 5G signal at the radar receiver.

    Now, we are modeling the interference from fundamental emissions of the 5G to the radar altimeter. So it is critical to account for the band separation of these two systems. By increasing the sampling rate of both signals and applying the proper frequency shift, we can account for this separation of the two bands in our model.

    Now, we can simulate the interference from fundamental emissions of 5G on the radar altimeter. On the bottom left, you are seeing the spectrum analyzer, where the yellow trace is showing the inputs to the radar receiver, and the blue trace is showing the output of the radar receiver. Please note that the fundamental emissions of 5G can cause blocking or saturation of the radar receiver, which inherently is a nonlinear effect.

    In our model, we are modeling the radar receiver with a linear model. So what we can do here is to measure the received power at the radar receiver input and compare that with the threshold that is specified in the specification as the saturation point of the radar receiver. On the right, you can see that saturation threshold is shown by the dashed red line. And the measured power that the radar receiver is shown by the blue line.

    We can see that as the radar is moving along the trajectory, There are measurement points that the input power to the radar receiver is above the threshold of the saturation of the receiver. OK, I would like to pause here and get your feedback through a poll. The question is, which of the following techniques would you evaluate and would you consider as a mitigation technique against this interference? Please use this poll to share your thoughts with us.

    As you can see, the choices are tilting the base station antenna, or maybe moving the location of the base station, applying beamforming on the base station antenna array to avoid radiation toward the flight path, or maybe applying a different signal processing and bringing the NTSB to the radar receiver. Or you might be thinking about changing the RF filter or some RF designs that you have in mind.

    So without any further ado, I would like to pass this presentation to one of our experts in the RF field, Giorgia, and see how we can bring in RF simulation into this workflow. Thank you.

    My name is Giorgia Zucchelli. I am the Product Manager at MathWorks for the RF Mixed-Signal area. I've been in MathWorks since 2009, when I started as an Application Engineer. And then, I transitioned in my current role in 2013. A long time ago before I joined MathWorks, I worked for an XP semiconductor and Philips Research, where I focused on modeling wireless RF systems, such as the one that we are presenting today.

    So let's dive deeper and see how our modeling analysis and simulation can help us in better understanding the effects of interference and, also, how it can help us in identifying mitigation strategies. The presence of a 5G base station positioned nearby a radar can cause two set of issues, and we are going to analyze both of them.

    The first problem is caused by the fundamental emissions that are out of bounds with respect to the radar signal but can have a much higher power. The second problem is caused by spurious emissions that can fall in the same bandwidth of their radar signal but can have much lower power. We start by modeling the possible effects caused by the 5G fundamental emissions.

    On the spectrum analyzer on the left, you see a 3GPP standard signal with 100-megahertz bandwidth. And on the same scope on the spectrum analyzer, you see the radar signal consisting of a chirp sweeping over at 150 megahertz. The 5G signal, depending on the base station configuration and regional settings, can have different center frequency, as can be seen here. It can be further away or closer to the radar signal. And in this case, the radar signal is centered around 4.3 gigahertz.

    In general, a [INAUDIBLE] bandwidth over a few megahertz is respected to avoid issues due to spectral regrowth or leakage. To verify if fundamental emissions can be a problem, we model the radar receiver with three basic fundamental components and measure the receiver output as it can be seen on the spectrum analyzer on the right.

    The first element of the receiver is a filter modeled by these S-parameters or scattering parameters. This allows us to model the frequency selectivity of the system. In general, the altimeter filters of the radar are not very selective due to the broadband nature of the radar itself. By modeling the filter explicitly, we can experiment with the system selectivity and, for example, increase the out-of-band rejection to reduce, effectively, the power of the 5G signal that enters the receiver.

    The second functional component of the receiver is an amplifier that allows us to model the gain noise figure and nonlinear effect of their front end, including, in particular, the saturation that can be modeled by means or the 1dB compression point as well as the Psat. Modeling the amplifier nonlinear effects allows us to estimate the impact of spectral regrowth caused by the 5G signal.

    The third functional component of the receiver is an analog-to-digital converter that allows us to model the receiver dynamic range as a function of the quantization noise, effective number of bits, and saturation power. As the plane gets closer to the ground, the power of the 5G signal-- but also, the radar signal at the input of the receiver, they both increase. While the radar signal is well within the operating range of the receiver, the 5G signal can cause saturation, as previously shown by Babak. And the spectral regrowth can effectively overlap with our desired signal, definitely reducing the SNR and potentially causing a false reading.

    So the big question that we want to answer here is whether 5G fundamental emissions can cause receiver overload and trigger force altitude reading. The answer depends. It depends on the location of the base station with respect to the flight path, the power, and the beam direction of the 5G transmitter, as well as the receiver specifications and, in particular, the filter selectivity and the overall saturation power.

    To answer the question, we simulate a worst-case, but realistic scenario and model selectivity and nonlinear effects of the RF receiver. We simulate the receiver using different RF techniques, such as circuit envelope or equivalent baseband for integration in the radar scenario simulation, just like Babak has described.

    In the worst-case scenario, the 5G base stations are along the landing trajectory, the transmitted power is maximized. And the antenna beam is steered towards the airport. Therefore, the receiver we model minimal out-of-band attenuation and a fairly low saturation power. In these extreme conditions, indeed, the altimeter can provide a false altitude reader, and this can be really disastrous.

    The good news here is that the problem can be solved with different mitigation strategies. For example, we can increase out-of-band spectral selectivity of the filter, as shown in the spectrum scope. Alternatively, we can increase the receiver saturation power-- for example, as it might occur when using an automatic gain control loop.

    Or we can change the signal processing algorithm to be more robust. For example, we can use a power spectral density estimation rather than rootmusic. And in this case, actually, the accurate modeling of the 5G waveform is extremely important, as the peak-to-average power ratio as well as the timing characteristics, they really have an impact on the ability to recover the correct altitude reading.

    The second potential problem that can be caused by 5G base stations positioned nearby radars is due to spur emissions, and this can lead to receiver desensitization. The overall outcome of spur emissions is that the receiver noise floor is increased by the spurs. And a degraded SNR can lead to a less precise altitude reading.

    On the spectrum analyzer on the right, we see the received signal as the plane gets closer to the ground. The waveform in yellow includes the 5G spurs, and the line in blue is the received signal without spurs. Spur emissions are modeled as inbound white noise, as seen on the blue spectrum trace on the spectrum analyzer on the left.

    Because they are inbound, the receiver filter has no impact on rejecting the spurs, while the amplifier and the ADC are the components that define the receiver dynamic range, noise floor, and SNR. So when we are analyzing this problem, it is particularly important that this component and the noise figure and quantization noise are properly modeled. The big question that we want to answer here is whether 3GPP emissions can cause the receiver desensitization-- that is to say, if they can increase the receiver noise floor by 1 dB. Also, this case, we've modeled the worst-case scenario in terms of base station locations for power and antenna directivity.

    The receiver noise floor can be rapidly computed, as can be seen here on the slides. And we can simulate that when the plane gets closer to the base station, the noise floor increases. And indeed, it can exceed the noise floor of the receiver. However, if this is a problem when the plane gets closer to the ground, also, the signal power increases. So effectively, the SNR improves even when the noise floor increased, which is good news.

    In summary, you can analyze the effects of interference between the radar and wireless systems with modeling and simulation, taking into account very different scenarios. As Kirsten showed, the opening of new frequency of operation is causing congestion in the RF spectrum that can potentially interfere with radar systems. And to better understand the different scenarios, Babak introduced a modeling simulation platform to anticipate how different systems can interact. And at last, we saw how to integrate such platforms with the simulation of RF [INAUDIBLE], including frequency selectivity, noise, and also nonlinearity.

    With this, we conclude our talk. And we would like to thank you very much for your attention, and we invite you to post your questions. Thank you.

    View more related videos