Main Content

datatip

Create data tip

Since R2019b

Description

Data tips are small text boxes that display information about individual data points. By default, the data tips include the data specified during chart creation that correspond to the individual data point.

Creation

Interactively create data tips by clicking on data points in a chart, for example line and scatter plots. You can also create data tips using the datatip function.

Description

datatip(target) creates a data tip on the first plotted data point of the specified chart, such as a line or scatter plot.

example

datatip(target,x,y) creates a data tip on the 2-D plotted data point specified by x and y. If you specify approximate coordinates, then datatip creates a data tip at the nearest data point.

datatip(target,x,y,z) creates a data tip on the 3-D plotted data point specified by x, y, and z. If you specify approximate coordinates, then datatip creates a data tip at the nearest data point.

example

datatip(target,'DataIndex',n) creates a data tip on the nth plotted data point by setting the DataIndex property.

datatip(___,Name,Value) specifies properties using one or more name-value pair arguments. Specify name-value pairs after all other arguments.

dt = datatip(___) returns a DataTip object. You can specify any of the input argument combinations in the previous syntaxes. This syntax is useful for controlling the properties of the data tip.

Input Arguments

expand all

Target, specified as an object with a DataTipTemplate property. Examples of objects with a DataTipTemplate property include Line, Histogram, Surface, and FunctionLine objects.

First coordinate of the data tip, specified as a scalar. The interpretation of the first coordinate depends on the type of axes:

  • For Cartesian axes, the first coordinate is the x-axis position using the same units as your data.

  • For polar axes, the first coordinate is the polar angle θ in radians.

  • For geographic axes, the first coordinate is the latitude in degrees.

By default, if you specify the approximate coordinates of a data point, then the datatip function creates a data tip at the nearest data point. The nearest data point depends on the type of chart. For example, on a line chart the nearest point has the smallest Euclidean distance from the approximate coordinates.

To create data tips between data points, set the SnapToDataVertex property to 'off'.

Second coordinate of the data tip, specified as a scalar. The interpretation of the second coordinate depends on the type of axes:

  • For Cartesian axes, the second coordinate is the y-axis position using the same units as your data.

  • For polar axes, the second coordinate is the radius r in the same units as your data.

  • For geographic axes, the second coordinate is the longitude in degrees.

By default, if you specify the approximate coordinates of a data point, then the datatip function creates a data tip at the nearest data point. The nearest data point depends on the type of chart. For example, on a line chart the nearest point has the smallest Euclidean distance from the approximate coordinates.

To create data tips between data points, set the SnapToDataVertex property to 'off'.

Third coordinate of the data tip, specified as a scalar. For Cartesian axes, the third coordinate is the z-axis position using the same units as your data.

By default, if you specify the approximate coordinates of a data point, then the datatip function creates a data tip at the nearest data point. The nearest data point depends on the type of chart. For example, on a line chart the nearest point has the smallest Euclidean distance from the approximate coordinates.

To create data tips between data points, set the SnapToDataVertex property to 'off'.

Properties

expand all

Data Tip

Index of the plotted data, specified as a positive integer.

For example, the plotted data of a 2-D object on a set of Cartesian axes is contained in its XData and YData properties. When you specify the DataIndex of a data tip, MATLAB® positions the data tip on the chart by indexing into XData and YData.

When you create a data tip using this property, do not specify the x, y, or z arguments.

Example: datatip(chart,'DataIndex',3) creates a data tip at the third plotted data point.

Display at closest data point, specified as one of these values:

  • 'on' – Display the data tip at the closest data point. The closest data point depends on the type of chart. For example, on a line chart the closest point has the smallest Euclidean distance from the specified location.

  • 'off' – Display the data tip at the closest specified location on the chart, even if it is between data points.

Offset from DataIndex, specified as a scalar. Use this property to create data tips between adjacent data points on a Line object by setting SnapToDataVertex to 'off' and InterpolationFactor to a scalar between 0 and 1.

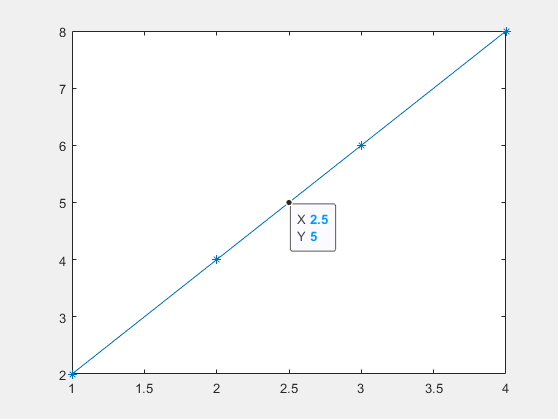
For example, create a data tip halfway between adjacent data points on a line by specifying the InterpolationFactor as 0.5.

x = 1:4;
y = 2.*x;
p = plot(x,y,'-*');
dt = datatip(p,'DataIndex',2, ...
               'Location','southeast', ...
               'SnapToDataVertex','off', ...
               'InterpolationFactor',0.5);

Line plot with data points displayed as asterisks and a data tip between asterisks

InterpolationFactor is not supported for data tips on all types of objects.

Location with respect to the data point, specified as one of these values:

ValueDescriptionAppearance
'northeast'Top-right corner of data point

Sample data tip at the top-right corner of the data point

'northwest'Top-left corner of data point

Sample data tip at the top-left corner of the data point

'southeast'Bottom-right corner of data point

Sample data tip at the bottom-right corner of the data point

'southwest'Bottom-left corner of data point

Sample data tip at the bottom-left corner of the data point

Example: dt.Location = 'southwest';

Selection mode for the Location property value, specified as one of these values:

  • 'auto' – The datatip function automatically selects the location.

  • 'manual' – If you set the Location property, the LocationMode property automatically changes to 'manual'.

This property is read-only.

Data tip content, specified as a cell array. By default, data tip content is a 2-by-1 cell array for 2-D data tips or a 3-by-1 cell array for 3-D data tips.

To add additional rows to the data tip content, use dataTipTextRow.

Font

Font name, specified as a supported font name or "FixedWidth". To display and print text properly, you must choose a font that your system supports. The default font depends on your operating system and locale.

To use a fixed-width font that looks good in any locale, use "FixedWidth". The fixed-width font relies on the root FixedWidthFontName property. Setting the root FixedWidthFontName property causes an immediate update of the display to use the new font.

Selection mode for the FontName property, specified as one of these values:

  • 'auto' – Use the same value as the FontName property for the DataTipTemplate object associated with the chart that contains the data tip.

  • 'manual' – If you set the FontName property, the FontNameMode property automatically changes to 'manual'.

Font size, specified as a scalar value greater than zero in point units. One point equals 1/72 inch.

Selection mode for the font size, specified as one of these values:

  • 'auto' – Use the same value as the FontSize property for the DataTipTemplate object associated with the chart that contains the data tip.

  • 'manual' – If you set the FontSize property, the FontSizeMode property automatically changes to 'manual'.

Character slant, specified as 'normal' or 'italic'.

Not all fonts have both font styles. Therefore, the italic font might look the same as the normal font.

Selection mode for the FontAngle property, specified as one of these values:

  • 'auto' – Use the same value as the FontAngle property for the DataTipTemplate object associated with the chart that contains the data tip.

  • 'manual' – If you set the FontAngle property, the FontAngleMode property automatically changes to 'manual'.

Text interpreter, specified as one of these values:

  • 'tex' — Interpret characters using a subset of TeX markup.

  • 'latex' — Interpret characters using LaTeX markup.

  • 'none' — Display literal characters.

TeX Markup

By default, MATLAB supports a subset of TeX markup. Use TeX markup to add superscripts and subscripts, modify the font type and color, and include special characters in the text.

Modifiers remain in effect until the end of the text. Superscripts and subscripts are an exception because they modify only the next character or the characters within the curly braces. When you set the interpreter to 'tex', the supported modifiers are as follows.

ModifierDescriptionExample
^{ }Superscript'text^{superscript}'
_{ }Subscript'text_{subscript}'
\bfBold font'\bf text'
\itItalic font'\it text'
\slOblique font (usually the same as italic font)'\sl text'
\rmNormal font'\rm text'
\fontname{specifier}Font name — Replace specifier with the name of a font family. You can use this in combination with other modifiers.'\fontname{Courier} text'
\fontsize{specifier}Font size —Replace specifier with a numeric scalar value in point units.'\fontsize{15} text'
\color{specifier}Font color — Replace specifier with one of these colors: red, green, yellow, magenta, blue, black, white, gray, darkGreen, orange, or lightBlue.'\color{magenta} text'
\color[rgb]{specifier}Custom font color — Replace specifier with a three-element RGB triplet.'\color[rgb]{0,0.5,0.5} text'

This table lists the supported special characters for the 'tex' interpreter.

Character SequenceSymbolCharacter SequenceSymbolCharacter SequenceSymbol

\alpha

α

\upsilon

υ

\sim

~

\angle

\phi

ϕ

\leq

\ast

*

\chi

χ

\infty

\beta

β

\psi

ψ

\clubsuit

\gamma

γ

\omega

ω

\diamondsuit

\delta

δ

\Gamma

Γ

\heartsuit

\epsilon

ϵ

\Delta

Δ

\spadesuit

\zeta

ζ

\Theta

Θ

\leftrightarrow

\eta

η

\Lambda

Λ

\leftarrow

\theta

θ

\Xi

Ξ

\Leftarrow

\vartheta

ϑ

\Pi

Π

\uparrow

\iota

ι

\Sigma

Σ

\rightarrow

\kappa

κ

\Upsilon

ϒ

\Rightarrow

\lambda

λ

\Phi

Φ

\downarrow

\mu

µ

\Psi

Ψ

\circ

º

\nu

ν

\Omega

Ω

\pm

±

\xi

ξ

\forall

\geq

\pi

π

\exists

\propto

\rho

ρ

\ni

\partial

\sigma

σ

\cong

\bullet

\varsigma

ς

\approx

\div

÷

\tau

τ

\Re

\neq

\equiv

\oplus

\aleph

\Im

\cup

\wp

\otimes

\subseteq

\oslash

\cap

\in

\supseteq

\supset

\lceil

\subset

\int

\cdot

·

\o

ο

\rfloor

\neg

¬

\nabla

\lfloor

\times

x

\ldots

...

\perp

\surd

\prime

´

\wedge

\varpi

ϖ

\0

\rceil

\rangle

\mid

|

\vee

\langle

\copyright

©

LaTeX Markup

To use LaTeX markup, set the interpreter to 'latex'. For inline mode, surround the markup with single dollar signs ($). For display mode, surround the markup with double dollar signs ($$).

LaTeX ModeExampleResult
Inline

'$\int_1^{20} x^2 dx$'

Equation with LaTeX inline mode

Display

'$$\int_1^{20} x^2 dx$$'

Equation with LaTeX display mode

The displayed text uses the default LaTeX font style. The FontName, FontWeight, and FontAngle properties do not have an effect. To change the font style, use LaTeX markup.

The maximum size of the text that you can use with the LaTeX interpreter is 1200 characters. For multiline text, this reduces by about 10 characters per line.

For examples that use TeX and LaTeX, see Greek Letters and Special Characters in Chart Text. For more information about the LaTeX system, see The LaTeX Project website at https://www.latex-project.org/.

Selection mode for the Interpreter property, specified as one of these values:

  • 'auto' — Use the same value as the Interpreter property for the DataTipTemplate object associated with the chart that contains the data tip.

  • 'manual' — If you set the Interpreter property, the InterpreterMode property automatically changes to 'manual'.

Cartesian Coordinate Data

Position along the x-axis, specified as a scalar using the same units as your data.

Position along the y-axis, specified as a scalar using the same units as your data.

Position along the z-axis, specified as a scalar using the same units as your data.

Polar Coordinate Data

Radius, specified as a scalar using the same units as your data.

This property applies only to data tips on polar plots.

Angle, specified as a scalar in degrees.

This property applies only to data tips on polar plots.

Geographic Coordinate Data

Latitude, specified as a scalar in degrees.

This property applies only to data tips on geographic plots.

Longitude, specified as a scalar in degrees.

This property applies only to data tips on geographic plots.

Interactivity

State of visibility, specified as "on" or "off", or as numeric or logical 1 (true) or 0 (false). A value of "on" is equivalent to true, and "off" is equivalent to false. Thus, you can use the value of this property as a logical value. The value is stored as an on/off logical value of type matlab.lang.OnOffSwitchState.

  • "on" — Display the object.

  • "off" — Hide the object without deleting it. You still can access the properties of an invisible object.

Context menu, specified as a ContextMenu object that provides data tip options. You cannot set this property.

Selection state, specified as 'on' or 'off', or as numeric or logical 1 (true) or 0 (false). A value of 'on' is equivalent to true, and 'off' is equivalent to false. Thus, you can use the value of this property as a logical value. The value is stored as an on/off logical value of type matlab.lang.OnOffSwitchState.

  • 'on' — Selected. If you click the object when in plot edit mode, then MATLAB sets its Selected property to 'on'. If the SelectionHighlight property also is set to 'on', then MATLAB displays selection handles around the object.

  • 'off' — Not selected.

Display of selection handles when selected, specified as 'on' or 'off', or as numeric or logical 1 (true) or 0 (false). A value of 'on' is equivalent to true, and 'off' is equivalent to false. Thus, you can use the value of this property as a logical value. The value is stored as an on/off logical value of type matlab.lang.OnOffSwitchState.

  • 'on' — Display selection handles when the Selected property is set to 'on'.

  • 'off' — Never display selection handles, even when the Selected property is set to 'on'.

Callbacks

Mouse-click callback, specified as one of these values:

  • Function handle

  • Cell array containing a function handle and additional arguments

  • Character vector that is a valid MATLAB command or function, which is evaluated in the base workspace (not recommended)

Use this property to execute code when you click the object. If you specify this property using a function handle, then MATLAB passes two arguments to the callback function when executing the callback:

  • Clicked object — Access properties of the clicked object from within the callback function.

  • Event data — Empty argument. Replace it with the tilde character (~) in the function definition to indicate that this argument is not used.

For more information on how to use function handles to define callback functions, see Create Callbacks for Graphics Objects.

Note

If the PickableParts property is set to 'none' or if the HitTest property is set to 'off', then this callback does not execute.

Object creation function, specified as one of these values:

  • Function handle.

  • Cell array in which the first element is a function handle. Subsequent elements in the cell array are the arguments to pass to the callback function.

  • Character vector containing a valid MATLAB expression (not recommended). MATLAB evaluates this expression in the base workspace.

For more information about specifying a callback as a function handle, cell array, or character vector, see Create Callbacks for Graphics Objects.

This property specifies a callback function to execute when MATLAB creates the object. MATLAB initializes all property values before executing the CreateFcn callback. If you do not specify the CreateFcn property, then MATLAB executes a default creation function.

Setting the CreateFcn property on an existing component has no effect.

If you specify this property as a function handle or cell array, you can access the object that is being created using the first argument of the callback function. Otherwise, use the gcbo function to access the object.

Object deletion function, specified as one of these values:

  • Function handle.

  • Cell array in which the first element is a function handle. Subsequent elements in the cell array are the arguments to pass to the callback function.

  • Character vector containing a valid MATLAB expression (not recommended). MATLAB evaluates this expression in the base workspace.

For more information about specifying a callback as a function handle, cell array, or character vector, see Create Callbacks for Graphics Objects.

This property specifies a callback function to execute when MATLAB deletes the object. MATLAB executes the DeleteFcn callback before destroying the properties of the object. If you do not specify the DeleteFcn property, then MATLAB executes a default deletion function.

If you specify this property as a function handle or cell array, you can access the object that is being deleted using the first argument of the callback function. Otherwise, use the gcbo function to access the object.

Callback Execution Control

Callback interruption, specified as 'on' or 'off', or as numeric or logical 1 (true) or 0 (false). A value of 'on' is equivalent to true, and 'off' is equivalent to false. Thus, you can use the value of this property as a logical value. The value is stored as an on/off logical value of type matlab.lang.OnOffSwitchState.

This property determines if a running callback can be interrupted. There are two callback states to consider:

  • The running callback is the currently executing callback.

  • The interrupting callback is a callback that tries to interrupt the running callback.

MATLAB determines callback interruption behavior whenever it executes a command that processes the callback queue. These commands include drawnow, figure, uifigure, getframe, waitfor, and pause.

If the running callback does not contain one of these commands, then no interruption occurs. MATLAB first finishes executing the running callback, and later executes the interrupting callback.

If the running callback does contain one of these commands, then the Interruptible property of the object that owns the running callback determines if the interruption occurs:

  • If the value of Interruptible is 'off', then no interruption occurs. Instead, the BusyAction property of the object that owns the interrupting callback determines if the interrupting callback is discarded or added to the callback queue.

  • If the value of Interruptible is 'on', then the interruption occurs. The next time MATLAB processes the callback queue, it stops the execution of the running callback and executes the interrupting callback. After the interrupting callback completes, MATLAB then resumes executing the running callback.

Note

Callback interruption and execution behave differently in these situations:

  • If the interrupting callback is a DeleteFcn, CloseRequestFcn, or SizeChangedFcn callback, then the interruption occurs regardless of the Interruptible property value.

  • If the running callback is currently executing the waitfor function, then the interruption occurs regardless of the Interruptible property value.

  • If the interrupting callback is owned by a Timer object, then the callback executes according to schedule regardless of the Interruptible property value.

Note

When an interruption occurs, MATLAB does not save the state of properties or the display. For example, the object returned by the gca or gcf command might change when another callback executes.

Callback queuing, specified as 'queue' or 'cancel'. The BusyAction property determines how MATLAB handles the execution of interrupting callbacks. There are two callback states to consider:

  • The running callback is the currently executing callback.

  • The interrupting callback is a callback that tries to interrupt the running callback.

The BusyAction property determines callback queuing behavior only when both of these conditions are met:

  • The running callback contains a command that processes the callback queue, such as drawnow, figure, uifigure, getframe, waitfor, or pause.

  • The value of the Interruptible property of the object that owns the running callback is 'off'.

Under these conditions, the BusyAction property of the object that owns the interrupting callback determines how MATLAB handles the interrupting callback. These are possible values of the BusyAction property:

  • 'queue' — Puts the interrupting callback in a queue to be processed after the running callback finishes execution.

  • 'cancel' — Does not execute the interrupting callback.

Ability to capture mouse clicks, specified as one of these values:

  • 'visible' — Capture mouse clicks when visible. The Visible property must be set to 'on' and you must click a part of the DataTip object that has a defined color. You cannot click a part that has an associated color property set to 'none'. The HitTest property determines if the DataTip object responds to the click or if an ancestor does.

  • 'all' — Capture mouse clicks regardless of visibility. The Visible property can be set to 'on' or 'off' and you can click a part of the DataTip object that has no color. The HitTest property determines if the DataTip object responds to the click or if an ancestor does.

  • 'none' — Cannot capture mouse clicks. Clicking the DataTip object passes the click through it to the object below it in the current view of the figure window. The HitTest property has no effect.

Response to captured mouse clicks, specified as 'on' or 'off', or as numeric or logical 1 (true) or 0 (false). A value of 'on' is equivalent to true, and 'off' is equivalent to false. Thus, you can use the value of this property as a logical value. The value is stored as an on/off logical value of type matlab.lang.OnOffSwitchState.

  • 'on' — Trigger the ButtonDownFcn callback of the DataTip object. If you have defined the ContextMenu property, then invoke the context menu.

  • 'off' — Trigger the callbacks for the nearest ancestor of the DataTip object that has one of these:

    • HitTest property set to 'on'

    • PickableParts property set to a value that enables the ancestor to capture mouse clicks

Note

The PickableParts property determines if the DataTip object can capture mouse clicks. If it cannot, then the HitTest property has no effect.

This property is read-only.

Deletion status, returned as an on/off logical value of type matlab.lang.OnOffSwitchState.

MATLAB sets the BeingDeleted property to 'on' when the DeleteFcn callback begins execution. The BeingDeleted property remains set to 'on' until the component object no longer exists.

Check the value of the BeingDeleted property to verify that the object is not about to be deleted before querying or modifying it.

Parent/Child

Parent, specified as a object with a DataTipTemplate property. Examples of objects with a data tip template include Line, Histogram, Surface, and FunctionLine objects. Move a data tip to another object by setting this property.

The object has no children. You cannot set this property.

Visibility of the object handle in the Children property of the parent, specified as one of these values:

  • "on" — Object handle is always visible.

  • "off" — Object handle is invisible at all times. This option is useful for preventing unintended changes by another function. Set the HandleVisibility to "off" to temporarily hide the handle during the execution of that function.

  • "callback" — Object handle is visible from within callbacks or functions invoked by callbacks, but not from within functions invoked from the command line. This option blocks access to the object at the command line, but permits callback functions to access it.

If the object is not listed in the Children property of the parent, then functions that obtain object handles by searching the object hierarchy or querying handle properties cannot return it. Examples of such functions include the get, findobj, gca, gcf, gco, newplot, cla, clf, and close functions.

Hidden object handles are still valid. Set the root ShowHiddenHandles property to "on" to list all object handles regardless of their HandleVisibility property setting.

Identifiers

This property is read-only.

Type of graphics object, returned as 'datatip'. Use this property to find all objects of a given type within a plotting hierarchy, for example, when searching for the type using findobj.

Object identifier, specified as a character vector or string scalar. You can specify a unique Tag value to serve as an identifier for an object. When you need access to the object elsewhere in your code, you can use the findobj function to search for the object based on the Tag value.

User data, specified as any MATLAB array. For example, you can specify a scalar, vector, matrix, cell array, character array, table, or structure. Use this property to store arbitrary data on an object.

If you are working in App Designer, create public or private properties in the app to share data instead of using the UserData property. For more information, see Share Data Within App Designer Apps.

Examples

collapse all

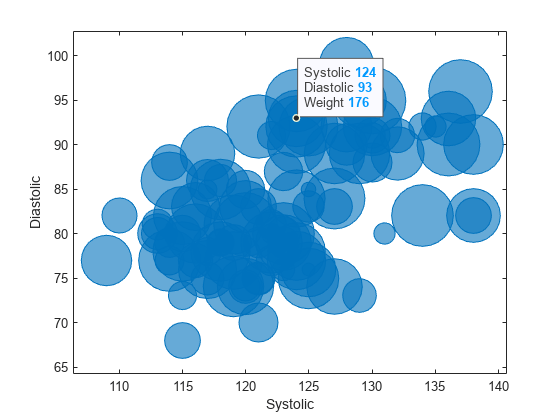
Create a table using the sample file patients.xls. Then, plot the Systolic, Diastolic, and Weight variables in a bubble chart. Then, add a data tip.

tbl = readtable("patients.xls");
b = bubblechart(tbl,"Systolic","Diastolic","Weight");

dt = datatip(b);

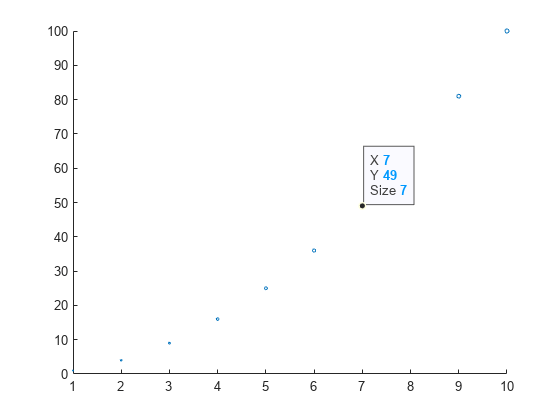
Plot data on a scatter chart and define sz as a vector that specifies the marker sizes. Return the Scatter object.

Then, create a data tip at a particular data point by specifying the x- and y-coordinates.

x = linspace(1,10,10);
y = x.^2;
sz = x;
sc = scatter(x,y,sz);

dt = datatip(sc,7,49);

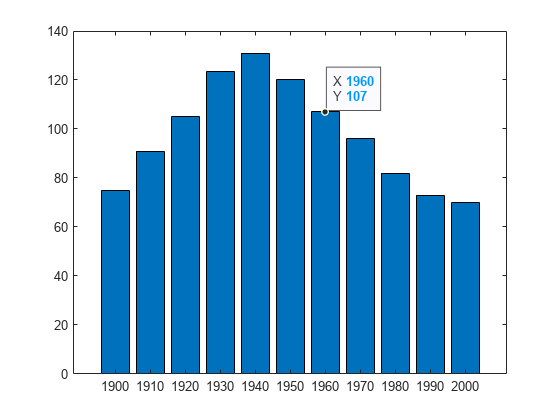
Plot data on a bar chart and return the Bar object. Then, create a data tip on the seventh bar by specifying the DataIndex name-value pair argument.

x = 1900:10:2000;
y = [75 91 105 123.5 131 120 107 96 82 73 70];
b = bar(x,y);

dt = datatip(b,'DataIndex',7);

Plot data on a scatter chart and return the Scatter object. Create a data tip at the data point near (3,0) by specifying x = 3 and y = 0 as approximate coordinates. When you create a data tip using approximate coordinates, the data tip appears at the closest data point.

x = linspace(0,2*pi,20);
y = sin(x);
sc = scatter(x,y);
grid on;

dt = datatip(sc,3,0);

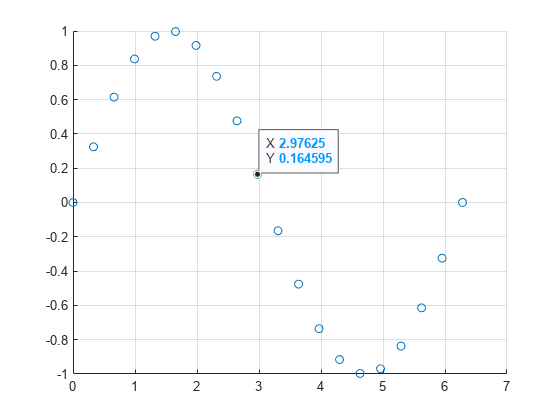
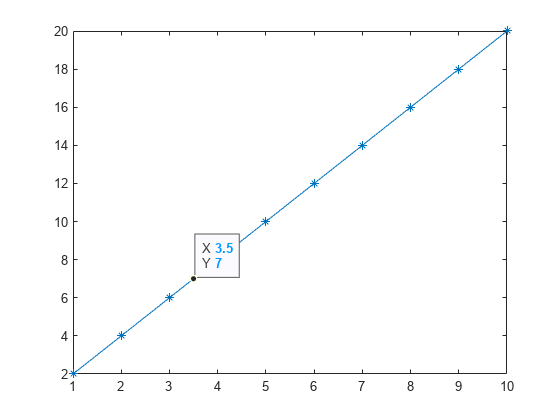
Plot data and return the Line object. Show a marker at each plotted data point. Then, create a data tip between two data points by specifying the x- and y-coordinates for the data tip and specifying the SnapToDataVertex name-value pair argument as 'off'.

x = linspace(1,10,10);
y = 2.*x;
p = plot(x,y,'-*');

dt = datatip(p,3.5,7,'SnapToDataVertex','off');

Tips

  • Interactively create data tips by clicking on data points in a chart. To assign interactively created data tips to a variable, use the findobj function.

    dt = findobj(chart,'Type','datatip');

  • To delete data tips, use the delete function.

    delete(dt);

Version History

Introduced in R2019b

expand all