nearestFace
Find faces nearest to specified point
Description
Examples
Find faces of a block nearest to the specified points.
Create a block geometry.
gm = multicuboid(3,2,1)
gm =
  DiscreteGeometry with properties:

       NumCells: 1
       NumFaces: 6
       NumEdges: 12
    NumVertices: 8
       Vertices: [8×3 double]
Plot the geometry with the face labels. Add the points with the coordinates (0 0 0.1), (2 0.9 1), and (1.5 -1 1) to the plot.
pdegplot(gm,"FaceLabels","on","FaceAlpha",0.2)
hold on
scatter3([0 2 1.5],[0 0.9 -1],[0.1 1 1],"filled","MarkerFaceColor","g")
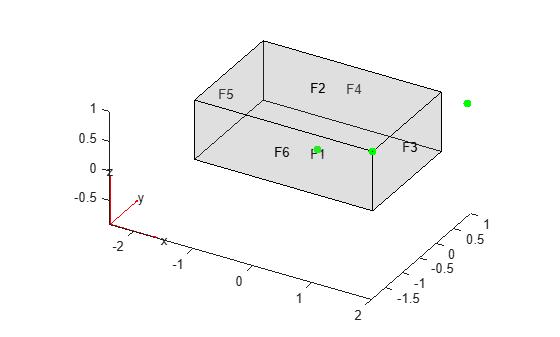
Find faces closest to the points with the coordinates (0 0 0.1), (2 0.9 1), and (1.5 -1 1). If several faces are equally close (within the tolerance) to the point, nearestFace returns the ID of one of the faces.
faceIDs = nearestFace(gm,[0 0 0.1; 2 0.9 1; 1.5 -1 1])
faceIDs = 1×3

     1     3     6
Find faces of the L-shaped membrane nearest to the specified points.
Create a model and include this geometry. The geometry of the L-shaped membrane is described in the file lshapeg.
model = createpde();
gm = geometryFromEdges(model,@lshapeg)
gm =
  AnalyticGeometry with properties:

       NumCells: 0
       NumFaces: 3
       NumEdges: 10
    NumVertices: 8
       Vertices: [8×2 double]
Plot the geometry with the face labels. Add the points with the coordinates (0 0), (1.1 -0.2), and (-0.5 0.5) to the plot.
pdegplot(gm,"FaceLabels","on")
hold on
scatter([0 1.1 -0.5],[0 -0.2 0.5],"filled")
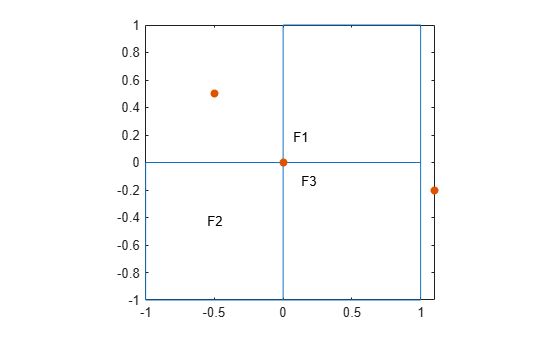
Find faces closest to the points with the coordinates (0 0), (1.1 -0.2), and (-0.5 0.5). If several faces are equally close (within the tolerance) to the point, nearestFace returns the ID of one of the faces.
faceIDs = nearestFace(gm,[0 0; 1.1 -0.2; -0.5 0.5])
faceIDs = 1×3

     2     3     1