andrewsplot
Andrews plot
Description
andrewsplot( creates an Andrews plot of the
multivariate data in the matrix X)X. The plot displays a continuous curve
for each observation in X. For more information, see Andrews Plot.
andrewsplot(
specifies additional options using one or more name-value arguments. For example, you can
standardize the data in X,Name=Value)X before plotting, and group the data using a
grouping variable.
andrewsplot( displays the
plot in the target axes ax,___)ax. Specify the axes as the first input
argument in any of the previous syntaxes.
p = andrewsplot(___)Line objects using any of the input argument combinations in the
previous syntaxes. Use p to modify properties of the plot after
creating it. For a list of properties, see Line Properties.
Examples
Create an Andrews plot to visualize grouped sample data.
Load the fisheriris data set, which contains four measurements (sepal length, sepal width, petal length, and petal width) from three species of iris flowers.
load fisheririsThe matrix meas contains all four measurements for 150 flowers. The cell array species contains the species name for each of the 150 flowers.
Create an Andrews plot, grouping the sample data by species.
andrewsplot(meas,Group=species)

The plot displays each observation (flower) as a smooth function over the interval [0,1]. The color of each curve indicates the flower species.
Create a second, simplified Andrews plot that displays only the median and quartiles of each group.
andrewsplot(meas,Group=species,Quantile=0.25)

The plot shows the median values for each group as a solid curve and the values for the other quartiles as dotted curves of the same color.
Visualize multidimensional data by using Andrews plots. First, group the data. Then, use standardization and quartiles to see the difference between the groups.
Load the patients data set, which contains medical information for 100 patients. Specify the descriptive category names Smoker and Nonsmoker rather than 1 and 0. Then, create a table using the Diastolic, Systolic, Weight, Age, and Smoker variables.
load patients
Smoker = categorical(Smoker,logical([1 0]), ...
    ["Smoker","Nonsmoker"]);
patientData = table(Diastolic,Systolic,Weight,Age,Smoker);
Create an Andrews plot from the variables in patientData. Use the last variable to group the data by smoker status.
andrewsplot(patientData{:,1:end-1},Group=patientData.Smoker)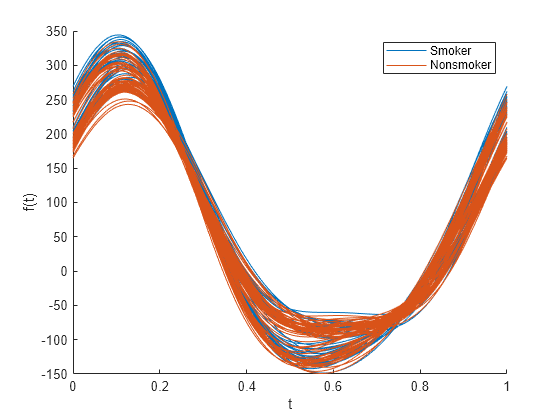
By default, the plot uses unstandardized data. The plot does not show a great difference between Smoker and Nonsmoker groups.
Standardize the numeric patientData variables before plotting.
andrewsplot(patientData{:,1:end-1},Group=Smoker,Standardize="on")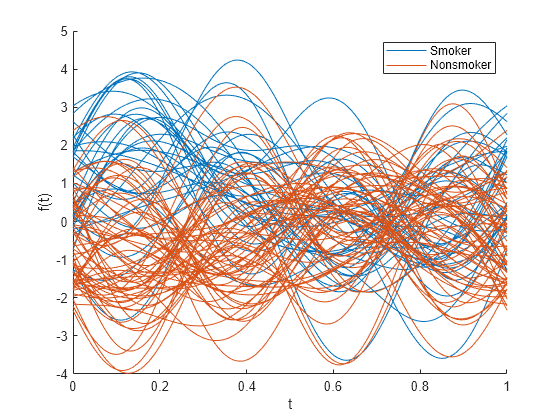
The resulting Andrews plot shows more variation between the Smoker and Nonsmoker groups. The plot is slightly crowded because it shows 100 curves, one for each patient in patientData.
Instead of displaying a curve for each observation, show the quartile curves for each group. The quartiles consist of the 25th percentile, median, and 75th percentile.
andrewsplot(patientData{:,1:end-1},Group=patientData.Smoker, ...
    Standardize="on",Quantile=0.25)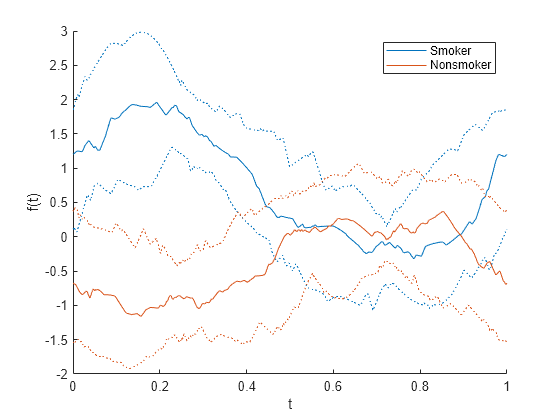
The quartile curves show differences between the Smoker and Nonsmoker groups. For example, at approximately 0.25, the two groups have quartile values that do not overlap.
Recall that each function displayed in the Andrews plot is a linear combination of the variables, whose coefficients change over time. (See Andrews Plot.) Compute the coefficients for the variables at time 0.25. This linear combination of the variables can help you differentiate between the groups.
t = 0.25;
variables = patientData.Properties.VariableNames(1:end-1)
variables = 1×4 cell
    {'Diastolic'}    {'Systolic'}    {'Weight'}    {'Age'}
coefficients = [1/sqrt(2) sin(2*pi*t) cos(2*pi*t) sin(4*pi*t)]
coefficients = 1×4

    0.7071    1.0000    0.0000    0.0000
At time 0.25, the Diastolic and Systolic variables have positive coefficients of similar magnitude, and the Weight and Age variables have 0 coefficients. The previous plot shows that, after the standardization of the data, the quartile curves for the Smoker group have positive values at time 0.25, and the quartile curves for the Nonsmoker group have negative values at time 0.25.
The plot and variable coefficients indicate that patients in the Smoker group tend to have higher Diastolic and Systolic values, providing one way to distinguish between the Smoker and Nonsmoker groups in patientData.
Adjust the appearance of an Andrews plot. You can set some plot properties in the call to andrewsplot. You can also specify the appearance of the plot before or after creating it.
Load the fisheriris data set, which contains four measurements (sepal length, sepal width, petal length, and petal width) from three species of iris flowers.
load fisheririsThe matrix meas contains all four measurements for 150 flowers. The cell array species contains the species name for each of the 150 flowers.
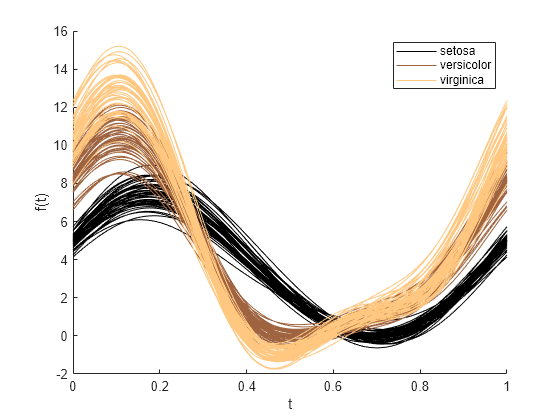
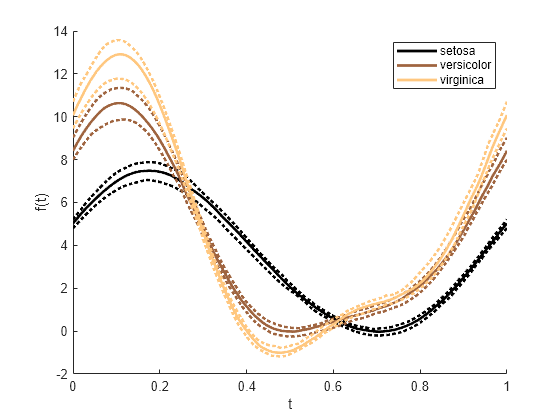
Create an Andrews plot using the measurement data in meas and the group data in species. Specify a nondefault color scheme (copper) for the grouped data by setting the color order before plotting.
colororder(copper(3))
andrewsplot(meas,Group=species)
Plot only the median, 25th percentile, and 75th percentile curves for each group in species. To make the plot lines thicker, specify the line width as 2. When you specify the LineWidth value in the call to andrewsplot, the function sets the line width of every curve in the plot to the same value.
andrewsplot(meas,Group=species,Quantile=0.25,LineWidth=2)
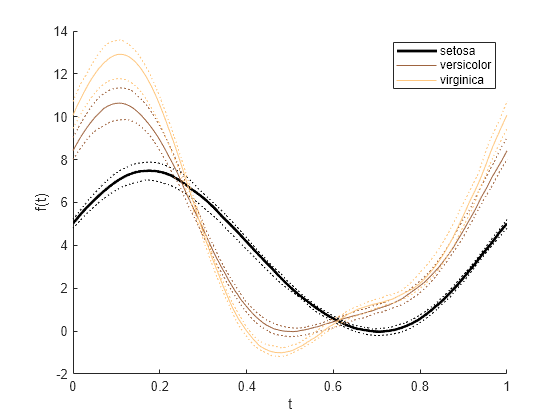
Recreate the previous plot, but increase the line width of only the curve representing the median measurements for the irises in the setosa group. First, create an array of Line objects p, where each object corresponds to a curve in the plot. Then, modify the LineWidth property of the first Line object in the array by using dot notation.
p = andrewsplot(meas,Group=species,Quantile=0.25)
p =
  9×1 Line array:

  Line    (median)
  Line    (lower quantile)
  Line    (upper quantile)
  Line    (median)
  Line    (lower quantile)
  Line    (upper quantile)
  Line    (median)
  Line    (lower quantile)
  Line    (upper quantile)
p(1).LineWidth = 2;
Input Arguments
Name-Value Arguments
Output Arguments
More About
Tips
You can modify certain aspects of the plot curves by specifying a property name and value for any of the properties listed in Line Properties. However, this approach applies the modification to all the curves in the plot. To modify only certain plot curves, use the syntax that returns
Lineobjects and use dot notation to adjust each object property individually. For an example, see Adjust Plot Appearance.
Version History
Introduced before R2006a