Perform Conditional Training During Incremental Learning
This example shows how to train a naive Bayes multiclass classification model for incremental learning only when the model performance is unsatisfactory.
The flexible incremental learning workflow enables you to train an incremental model on an incoming batch of data only when training is necessary (see What Is Incremental Learning?). For example, if the performance metrics of a model are satisfactory, then, to increase efficiency, you can skip training on incoming batches until the metrics become unsatisfactory.
Load Data
Load the human activity data set. Randomly shuffle the data.
load humanactivity
n = numel(actid);
rng(1) % For reproducibility
idx = randsample(n,n);
X = feat(idx,:);
Y = actid(idx);
For details on the data set, enter Description at the command line.
Train Naive Bayes Classification Model
Configure a naive Bayes classification model for incremental learning by setting:
The maximum number of expected classes to 5
The tracked performance metric to the misclassification error rate, which also includes minimal cost
The metrics window size to 1000
The metrics warmup period to 50
initobs = 50;
Mdl = incrementalClassificationNaiveBayes('MaxNumClasses',5,'MetricsWindowSize',1000,...
    'Metrics','classiferror','MetricsWarmupPeriod',initobs);
Fit the configured model to the first 50 observations.
Mdl = fit(Mdl,X(1:initobs,:),Y(1:initobs))
Mdl =
  incrementalClassificationNaiveBayes

                    IsWarm: 1
                   Metrics: [2×2 table]
                ClassNames: [1 2 3 4 5]
            ScoreTransform: 'none'
         DistributionNames: {1×60 cell}
    DistributionParameters: {5×60 cell}


  Properties, Methods
haveTrainedAllClasses = numel(unique(Y(1:initobs))) == 5
haveTrainedAllClasses = logical
   1
Mdl is an incrementalClassificationNaiveBayes model object. The model is warm (IsWarm is 1) because all the following conditions apply:
The initial training data contains all expected classes (
haveTrainedAllClassesistrue).Mdlis fit toMdl.MetricsWarmupPeriodobservations.
Therefore, the model is prepared to generate predictions, and incremental learning functions measure performance metrics within the model.
Perform Incremental Learning with Conditional Training
Suppose that you want to train the model only when the most recent 1000 observations have a misclassification error greater than 5%.
Perform incremental learning, with conditional training, by following this procedure for each iteration:
Simulate a data stream by processing a chunk of 100 observations at a time.
Update the model performance by passing the model and current chunk of data to
updateMetrics. Overwrite the input model with the output model.Store the misclassification error rate and the mean of the first predictor in the second class to see how they evolve during training.
Fit the model to the chunk of data only when the misclassification error rate is greater than 0.05. Overwrite the input model with the output model when training occurs.
Track when
fittrains the model.
% Preallocation
numObsPerChunk = 100;
nchunk = floor((n - initobs)/numObsPerChunk);
mu21 = zeros(nchunk,1);
ce = array2table(nan(nchunk,2),'VariableNames',["Cumulative" "Window"]);
trained = false(nchunk,1);

% Incremental fitting
for j = 1:nchunk
    ibegin = min(n,numObsPerChunk*(j-1) + 1 + initobs);
    iend   = min(n,numObsPerChunk*j + initobs);
    idx = ibegin:iend;
    Mdl = updateMetrics(Mdl,X(idx,:),Y(idx));
    ce{j,:} = Mdl.Metrics{"ClassificationError",:};
    if ce{j,"Window"} > 0.05
        Mdl = fit(Mdl,X(idx,:),Y(idx));
        trained(j) = true;
    end
    mu21(j) = Mdl.DistributionParameters{2,1}(1);
end
Mdl is an incrementalClassificationNaiveBayes model object trained on all the data in the stream.
To see how the model performance and evolve during training, plot them on separate tiles. Identify periods during which the model is trained.
t = tiledlayout(2,1);
nexttile
plot(mu21)
hold on
plot(find(trained),mu21(trained),'r.')
ylabel('\mu_{21}')
legend('\mu_{21}','Training occurs','Location','best')
hold off
nexttile
plot(ce.Variables)
ylabel('Misclassification Error Rate')
legend(ce.Properties.VariableNames,'Location','best')
xlabel(t,'Iteration')
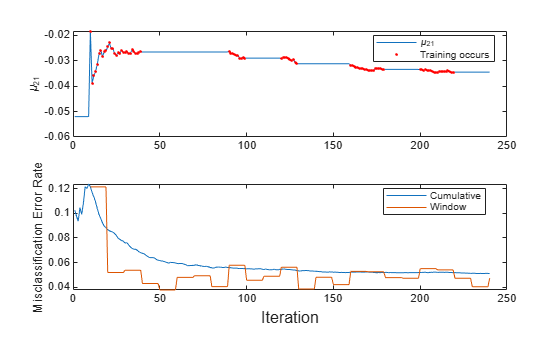
The trace plot of shows periods of constant values, during which the model performance within the previous observation window is at most 0.05.
See Also
Objects
Functions
predict|fit|updateMetrics