Define bode plot frequency limits
14 views (last 30 days)
Show older comments
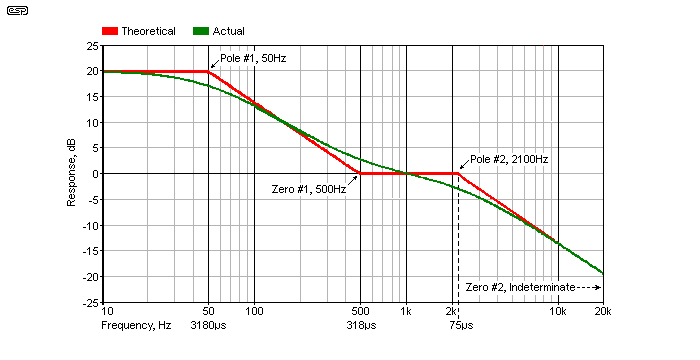
I have written this code to get the transfer function of a 2 op amps RIAA equalizator.
RIAA:
>> format long;
>> s = tf('s');
>> options = bodeoptions;
>> options.FreqUnits = 'Hz'; % or 'rad/second', 'rpm', etc.
>> R5L = 4.7e3;
>> ZC2L = 1/(22e-6*s);
>> Z11 = R5L + ZC2L;
>> Z11min = minreal(Z11);
>> R4L = 180e3;
>> ZC1L = 1/(22e-9*s);
>> R3L = 10e3;
>> ZF11 = R4L;
>> ZF12 = ZC1L + R3L;
>> %ZF1 = ZF11|ZF12;
>> ZF1 = (ZF11*ZF12)/(ZF11 + ZF12);
>> ZF1min = minreal(ZF1);
>> H1 = 1 + (ZF1min/Z11min);
>> H1min = minreal(H1);
>> RL6 = 100e3;
>> R6L = 100e3;
>> ZF2 = R6L;
>> R7L = 2.7e3;
>> ZC3L = 1/(22e-6*s);
>> Z22 = R7L + ZC3L;
>> H2 = 1 + (ZF2/Z22);
>> HF = H1*H2;
>> R8L = 750;
>> ZC4L = 1/(100e-9*s);
>> ZC5L = 1/(1e-6*s);
>> R9L = 100e3;
>> H3 = HF*(ZC4L/(ZC4L + R8L));
>> H3min = minreal(H3);
>> H4 = H3min*(R9L/(ZC5L + R9L));
>> H4min = minreal(H4);
The circuit and the bode plot is shwon above.


What I want to do is set the frequency limits, from 10Hz to 20Khz, when I type bode(H4,options), or bode(H4min,options), any tip on how to do that?
0 Comments
Answers (1)
Vinay
on 16 Sep 2024
Hii Gabriel,
The bode plot of the equalizer circuit within the required frequency limits can be plotted by specifying the frequency range in the “bode” function call.The “bode” function have an argument to specify the frequency range for the bode plot.
The following code generates a Bode plot for the frequency range spanning from 10 Hz to 20 kHz.
% Define frequency range from 10 Hz to 20 kHz
freq_range = logspace(log10(10), log10(20000), 1000);
% Bode plot for H4 with specified frequency range
bode(H4, freq_range, options);
% Bode plot for H4min with specified frequency range
bode(H4min, freq_range, options);
Kindly refer to the below documentation of “bode plot”:
0 Comments
See Also
Community Treasure Hunt
Find the treasures in MATLAB Central and discover how the community can help you!
Start Hunting!