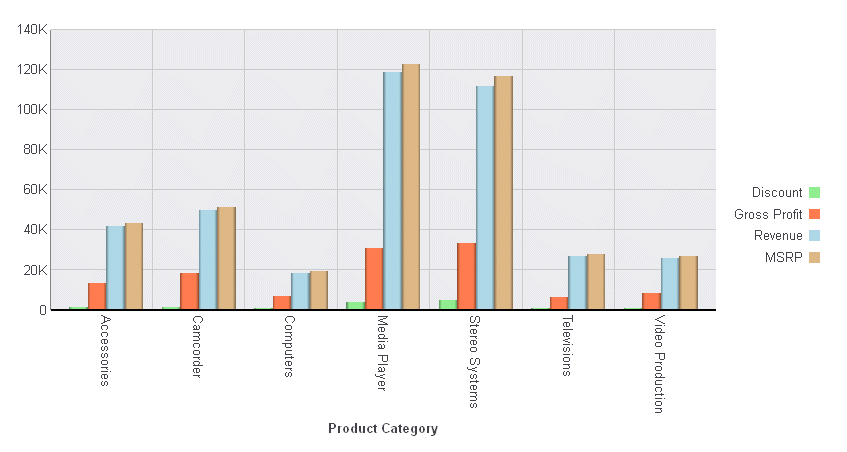
Legend markers displayed to the *right* of the labels
6 views (last 30 days)
Show older comments
I'd like to have the markers in my Matlab plot legend displayed to the right of the labels, instead of to their left as happens by default.
There seems to be no parameter for this in legend objects, and I only found suggested workarounds that were very clumsy, i.e. moving each element of the legend bit by bit, i.e. specifying the x and y coordinates of each.
This can be done easily in other programs such as Excel:

Is there a way to achieve this in Matlab?
1 Comment
Adam Danz
on 6 Feb 2020
I'm not sure if there is an undocumented way of doing that or not but I doubt it.
Answers (1)
Adam Danz
on 6 Feb 2020
Edited: Adam Danz
on 10 Feb 2020
Here's a way to make it look like the legend markers are to the right of the legend text. But in reality, the legend doesn't have any text and the text you see is a child of the axes, not the legend. This potentially has problems such as when legend strings become long but you could give it a shot.
The only input is the labels variable that lists the legend labels for each object. The rest can be copy-pasted in to your code. See the lines that contain an arrow in the comments (<---) for things you can tweek.
% Create plot
y = [2 2 3; 2 5 6; 2 8 9; 2 11 12];
bar(y)
labels = {'Rochester', 'Cincinnati', 'Sofia'}; % <--- list legend labels
% Set the axis limits so they don't change
axh = gca();
hold(axh,'on')
axh.XLimMode = 'manual';
axh.YLimMode = 'manual';
% Shrink the width of the axes to make room for legend
axh.Position(3) = axh.Position(3)*.7; % <--- Create more space for longer labels
% Create legend without labels
fontsize = 10; % <--- font size of labels
lh = legend(repmat({''},numel(labels),1),'EdgeColor','None','FontSize',fontsize);
% Reposition the legend to the right of the text
lh.Position(1:2) = [1-lh.Position(3)-.01, axh.Position(2)]; % <--- control space betwen legend and right figure edge
% Add text labels that act as legend strings
yl = ylim(axh);
xl = xlim(axh);
th = text(repmat(xl(2)+range(xl)*.02,1,numel(labels)),... % <--- control space between axis edge and labels
linspace(yl(1),yl(1)+range(yl)*lh.Position(4),numel(labels)), ...
labels, 'HorizontalAlignment','Left','VerticalAlignment','Baseline','FontSize',fontsize);

3 Comments
Adam Danz
on 10 Feb 2020
Good decision. The answer was more of a proof of concept and comes with potential problems as I suggested in the answer. Another alternative is to creat the legend with empty text labels so you just have the color and space next to them. Then you fill in the next with other software.
See Also
Categories
Find more on Legend in Help Center and File Exchange
Community Treasure Hunt
Find the treasures in MATLAB Central and discover how the community can help you!
Start Hunting!