Highlights
Follow


Image Analyst

Ask Me Anything about image analysis or the Mathworks community

Image Analyst on 18 Jun 2024 (Edited on 19 Jun 2024)
Latest activity Reply by Cesar Nieves about 2 hours ago

Hello, everyone! I’m Mark Hayworth, but you might know me better in the community as Image Analyst. I've been using MATLAB since 2006 (18 years). My background spans a rich career as a former senior scientist and inventor at The Procter & Gamble Company (HQ in Cincinnati). I hold both master’s & Ph.D. degrees in optical sciences from the College of Optical Sciences at the University of Arizona, specializing in imaging, image processing, and image analysis. I have 40+ years of military, academic, and industrial experience with image analysis programming and algorithm development. I have experience designing custom light booths and other imaging systems. I also work with color and monochrome imaging, video analysis, thermal, ultraviolet, hyperspectral, CT, MRI, radiography, profilometry, microscopy, NIR, and Raman spectroscopy, etc. on a huge variety of subjects.
I'm thrilled to participate in MATLAB Central's Ask Me Anything (AMA) session, a fantastic platform for knowledge sharing and community engagement. Following Adam Danz’s insightful AMA on staff contributors in the Answers forum, I’d like to discuss topics in the area of image analysis and processing. I invite you to ask me anything related to this field, whether you're seeking recommendations on tools, looking for tips and tricks, my background, or career development advice. Additionally, I'm more than willing to share insights from my experiences in the MATLAB Answers community, File Exchange, and my role as a member of the Community Advisory Board. If you have questions related to your specific images or your custom MATLAB code though, I'll invite you to ask those in the Answers forum. It's a more appropriate forum for those kinds of questions, plus you can get the benefit of other experts offering their solutions in addition to me.
For the coming weeks, I'll be here to engage with your questions and help shed light on any topics you're curious about.
Cesar Nieves
Cesar Nieves about 2 hours ago
Hi,
I am trying to simulate the motion of ions under electric field using poisson equation, drift and diffusion equations, and general mass equation for continuity. Also, I am using Eistein relationship to relate electrical mobility to diffusion. However, my code doesnt seem to work well. I am not able to see changes in concentration, potential or electric field profile with time. I can only see the results at time 0s.
saleel
saleel on 21 Jul 2024 at 2:38
Hi
Why does this error appear during training in yolo object detection algorithm?
It was working and I got results, but when I increased the dataset, this error started appearing during training!!!
Error using collateMiniBatch
Unable to apply function specified by 'MiniBatchFcn' value.
Error in minibatchqueue>@(x)collateMiniBatch(x,options.InternalMiniBatchFcn,options.IsDefault.MiniBatchFcn,options.NumInputsMiniBatchFcn,options.NumOutputs) (line 291)
collateFcn = @(x)collateMiniBatch(x,options.InternalMiniBatchFcn,...
Error in nnet.internal.cnn.DataLoader/nextBatch (line 85)
miniBatch = this.CollateFcn(miniBatch);
Error in deep.internal.data.DatastoreDispatcher/readNextMiniBatchIntoCache (line 153)
[this.CachedMiniBatch, this.CachedMiniBatchSize] = nextBatch(this.Dataloader);
Error in deep.internal.data.DatastoreDispatcher/next (line 59)
readNextMiniBatchIntoCache(this);
Error in deep.internal.data.BackgroundDispatcher>iCallNextOnPoolConstant (line 571)
[miniBatch, nextMiniBatchSize] = constantObject.Value.next();
Caused by:
Error using cat
Dimensions of arrays being concatenated are not consistent.
Image Analyst
Image Analyst on 21 Jul 2024 at 2:51
Sorry, I don't really know. You should try Answers forum, or call tech support.
Frank
Frank on 18 Jul 2024 at 13:45
Hi Mark,
I have been writing matlab apps that visualize field experimental data involving movements of instrumented people and physical objects, tracking of released vapor clouds, data from referee instrumentation, and data from cfd simulations. The apps typically involve time sequenced and synchronized plotting of points and lines in uiaxes, contourf plotting of vapor concentrations, synchronized time lapsed photos or sometimes videos frame by frame. They typically wind up having between 5 and 10 axes containg plots or images which are updated with data synchronized in time on a second by second basis for a few thousand seconds.
I often need to present the visualizations to groups of people and for that I need for the app to run as quickly as it can to maintain their attention and still present the important details. I try to minimize numerical calculations in the app by pre-processing and synchronizing all the data and imagery beforehand so that the app largely involves just managing display of the graphical objects. I found that even simple graphical displays of the data (such as calls to scatter, plot, patch, contourf, etc), which I do for a few dozen sets of data every second for the thousands of seconds covered, progressively slows the real-time display as more and more data sets are involved, even with generous application of drawnows.
I have been trying to generate the displays as arrays of graphical objects and then sequence the display by adjusting object properties like visibility, alpha, etc instead of calling the scatter, plot, patch, etc functions. That allows me to control the speed of the display much better, but generating the graphical object arrays seems to be generating a delay when the app is doing it. Sorry for the long-winded description, but my question is fairly simple I think.
Instead of calling scatter at each second for all the different data streams i have been doing something like this example (the x and y here are just nominal examples of a dataset):
x = (1:50);
y = x.^1.5;
i = (1:50);
ax = axes;
xlim(ax,[0 50]);
ylim(ax,[0 360]);
hold(ax,"on");
H = arrayfun(@(i) scatter(ax,x(i),y(i),"filled","black","Visible","off"),i);
[Then I control which points are displayed when by something like the following]
for j=1:50
H(j).Visible = "on";
pause(0.05);
end
I can make points appear as a sequence of points (or other objects), or appear as a single point moving by toggling the visibility properties or alphas if needed.
Finally my question. The multiple arrayfun calls for arrays of a few thousands of elements seem to take a bit of time in the real time running of the app, but after they are done things are very fast. I think I would like to preprocess the graphical objects (eg. the H above) and then store the graphical objects in a .mat file and simply load them when the app starts up. I have been able to save them (eg H above) into a .mat file and then load them back in to the workspace, but then how do I add them to the axes that I want to add them to? For example if I try
saveobj('H.mat','H');
Then delete H by hand with a right click (for some reason delete(H) doesn't work at the moment), create new axes as above, how do I add the just-loaded H to the newly created axes?
[I have another question perhaps for later about generating a few hundred contourf plots in advance as graphical objects and then storing them, loading them, and displaying them without calling contourf. And maybe storing them as images and displaying them that way so I can adjust the alpha]
Thanks in advance.
Image Analyst
Image Analyst on 19 Jul 2024 at 14:40
Can you use a movie showing "old" data instead of showing it "live" with data as it's being collected? I'm attaching a demo of how to make a movie from figures.
But I think you're on the right track. Constantly calling drawnow forces the screen to repaint and, while it will show you data "live" as it comes in, it can slow things down, so you might continue to try to hide the figures (set visibility off) until all of the plots are ready, then, in a burst, set all of the visibilities on to show them all at once.
Frank
Frank on 19 Jul 2024 at 17:09 (Edited on 19 Jul 2024 at 17:12)
Thanks much. I asked the same question on the answers board and Voss pointed me to the copyobj command as the basic answer to the question. Typically I do make movies (basically recorded screenshots) of the overall visualization once it runs and then edit the speed of the video to suit the patience of the particular audience. Speeding it up crams data and activities that evolve over hour time frames to a minute or so and things can look a little like busy bees, but it gets the point across. A main reason I want to speed up the execution of the app is the time it takes to write and debug the apps, which usually takes a week or so. The apps often take ten or more minutes to run and fixing a bug (often a mistype of mine) that occurs after midway in the execution means I have to let it run until the point at which the bug happens. Some folks have asked for real-time visualization but I am unsure if that is going to happen. There is just a lot of pre-processing of data, particularly synchronizing mulitple data streams, that I don't see a workable way to do in real time without very exacting control of the set up and conduct of the experiments, which is hard because it involves multiple researchers. I do have a couple of graduate students working with a couple of the virtual reality engines which I want to somehow incorporate but I am still unsure how well that is going to work. It seems those things take a lot computer memory and power and may not be geared to real time interactivity.
Thanks for the surf movie demo. I can use that in the classes I teach that incorporate matlab work by my students. Videos are an entirely different problem The video I use in the experiment visualizations typically don't come with datetime stamps to synch the video with other instrumental data streams and synching the video displays with display of other data is a pain, currently trial and error by hand frame by frame. The frame rates are also a pain because they are approximately 30, 60 or sometimes more frames per second, but not exactly, and it seems to vary with time, which makes using frame numbers mapped to datetime increments doesn't work well. Oh well.
Xiaofeng
Xiaofeng on 18 Jul 2024 at 8:30
Hello,
I develop project with Matlab Simulink based on S32K3 MCU series. I hope to combine Simulink Module with C code. Currently, I have installed MinGW-w64 version 8.1 for R2023B, It works normally. Simulink module works normally. But I can't download code to my MCU, since Simulink reports error. "Error(s) encountered while building "xxx". How can I fix this question?
Thanks!
Image Analyst
Image Analyst on 19 Jul 2024 at 14:34
Sounds like a question for the Answers forum, especially since I don't have Simulink and don't know anything about Simulink.
Jared
Jared on 15 Jul 2024 at 23:19
Hello,
I'm a benthic marine ecologist working with sea floor images. I am currently using the single camera calibrator app while trying to 'relearn' Matlab after a few years hiatus. I am able to calibrate and export cameraParams and estimationErrors from ~ 20 checkerboard images, but struggling with the next steps.
1) Conducting EDA and visualizing the normalized pixel coordinates for each camera (n = 2). Attached .mat result file as example. The app itself corrects the distortion automatically with a GUI button click, but I'll like to understand the matrices output and develop a distortion plot of raw vs. normalized points. Can you help?
2) Conceptually (and in practice) integrating the camera-specific radial distortion (i.e. normalization) into our data collection capabilities and SOP. What might be the best way to automate corrections into our image analyses? Such as developing generalized cut-offs for edge distortions or trying to correct every image prior to data collection.
3) Does MATLAB have any toolboxes or development in AI/ML techniques to classify and train for object detection (lines, boxes, polygons) or point-based quantification (e.g. point contact estimators for habitat types). I am not up to speed on MATLAB offerings.
Thank you for any professional suggestions or coding aids.
Jared
Image Analyst
Image Analyst on 19 Jul 2024 at 14:33 (Edited on 19 Jul 2024 at 14:33)
Sounds like a good question for the Answers forum. I haven't done a lot with spatial transforms/warping but you might look at imwarp and Steve's blog Spatial transformations Defining and applying custom transforms Steve on Image Processing
Axis Friday
Axis Friday on 15 Jul 2024 at 7:39
Hello,
I am an undergrad in engineering. Irrelevant to my career and degree, I am deeply interested in color science. Where would you reccomend I begin, whether those be texts or otherwise, on learning applying my understanding of color science albeit elementary. I want to learn more about color spaces and how to define them, transform inbetween them, and implement CIE color systems in my own applications.
Image Analyst
Image Analyst on 19 Jul 2024 at 14:30
@Axis Friday Color science is a difficult topic, mostly because it's not straightforward like spectroscopy -- it must necessarily include information of the human visual system, which varies from person to person and is difficult to model and quantify. It's the kind of thing where you need to see it over and over again. A little bit more sinks in each time you see it. I already had a firm grasp of spectroscopy and optics due to my Ph.D. but this color science was a whole other beast. I started out taking courses offered by the main spectrophotometer manufacturers: HunterLabs, Datacolor, X-rite, BYK-Gardner, Konica Minolta, Perkin Elmer, Thermo Scientific, StellarNet, etc. Look on the web sites for things like education or seminars. You can start with reading on their web sites, but to really understand you need to attend instructor-led, in-person seminars so you can ask questions. Some, but not all, of the companies offer in-person seminars occasionally. I took several seminars before it started to sink in and I felt I began to understand it. Then to really understand it you need to teach it. I began offering day long color science seminars at P&G for our scientists. Even then each time I taught it, I understood it a little better.
Another good resource is Wikipedia. There are numerous articles there on all aspects of color science.
If you really want to get into color science then you need to get a graduate degree in color science from the Munsell Color Science Lab at the Rochester Institute of Technology in New York state. https://www.rit.edu/science/munsell-color-lab
It's probably the top color science research center in the world.
Also, see my attached seminar on color calibration.
There is also a Color & Imaging Conference that I used to attend:
If you can go to that, you will learn a lot since all of the worlds top color researchers go there. You might be able to browse through old proceedings and read papers that interest you.
You can also search VisionBib for articles on color:
This is a database of nearly all image processing articles, and is maintained and updated by the University of Southern California (you know, where the very famous "Lena" picture came from https://www.wired.com/story/finding-lena-the-patron-saint-of-jpegs/ )
It can take a long time to learn, even a lifetime which is why they're still studying it and having conferences and papers on it. I've talked to the worlds top color scientists (like Mark Fairchild, Ronnie Luo, Stephen Westland | The University of Leeds, etc. and they all admit even they don't know everything and are still learning. Dr. Wesland had a color toolbox he's uploaded to the File Exchange:
Gokul Kiran
Gokul Kiran on 12 Jul 2024 at 6:30
Hello sir can i get answer for this
Display all 2 digit numbers in such a way that there should be consecutive pulses for a digit in the interval of 0.25 seconds and the interval between the digits should be 0.5 seconds. Interval between two numbers should be 1 second
Ignore the digits that have 0 in it.
Image Analyst
Image Analyst on 12 Jul 2024 at 14:16
Yes, you can. Just ask in the Answers forum.
This looks like a homework problem. If you have any questions ask your instructor or read the link below to get started:
Obviously, if it is homework, we can't give you the full solution because you're not allowed to turn in our code as your own. So after you read the link, post your homework there and you'll get hints. This is the kind of question that should be posted there rather than here.
In the meantime, take a look at repmat and this link
Ahmed
Ahmed on 10 Jul 2024 at 10:21
Hello sir, i'm trying to create a Matlab code that matches the (4000 patch) RGB values of two cameras in a meshy way and generates a 3D cube lut. i have used scatterdatatinterpolatant (method: linear and extrapolation: boundary). This approach is limiting my gamut and does not interpolate the out of the convex hull points in a smooth way. I tried to add plenty of points around the convex hull, but I didn't like the result because the edge became non meshy.
Is there a better way to extrapolate the points out off the convex hull smoothly?
Image Analyst
Image Analyst on 12 Jul 2024 at 14:21
I'd ask this in Answers and supply your patch data.
scatteredInterpolant seems like a reasonable approach. After you get the interpolant you should run through all 16 million color possibilities, and of course some of them will be outside your training gamut but I don't think that should matter. I think it should still give you values. What did you get when you gave it out-of-gamut values?
Daniel
Daniel on 8 Jul 2024 at 11:02
I had to reinstall matlab and the process deleted an app.
I have the contents in a text file - if i rename it with .mlapp it doesn't load.
I would paste the code into a new app in app designer, but of course the code is greyed out and can't be edited.
Do you know a way around this?
Image Analyst
Image Analyst on 8 Jul 2024 at 12:00
Just try pasting in the individual button contents one at a time. You might have to recreate all your controls on the GUI first, and then paste in just the button function contents, not all the protected/gray code.
Patrizia
Patrizia on 8 Jul 2024 at 8:17 (Edited on 8 Jul 2024 at 8:18)
Dear Sir
I am looking for help in revising a code I wrote with the aim of detecting plastic bottles in images. There are probably errors in the code, causing an error in the final function 'metrics = evaluateObjectDetection(detectionResults, testData)'.
I would need help to complete the code so that it can return a final result, even if it is inaccurate. Can you help me? I look forward to your kind feedback. Thank you in advance!
Patrizia
Image Analyst
Image Analyst on 8 Jul 2024 at 19:20
I understand. Perhaps you can hire a local university or a consultant firm like SRI International who will sign your confidential disclosure agreement and work on your confidential project.
Patrizia
Patrizia on 8 Jul 2024 at 12:29
unfortunately the contents are confidential..
Image Analyst
Image Analyst on 8 Jul 2024 at 11:58
Post the image and code in Answers and we'll deal with the question there.
Viren
Viren on 7 Jul 2024 at 20:19
Dear Sir,
How to l find so many formulas under the analog and digital filter designs as well as DSP in MATLAB? Are there any documentations for the digital filter designs as well as Digital Signal Processing in MATLAB? Some of the formulas MATLAB used for above mentioned topic, is not available DSP books or Advance Communication books.
Viren
Image Analyst
Image Analyst on 7 Jul 2024 at 23:50
Some of the functions will have a reference to an article that describes the algorithm that the Mathworks developers implemented in MATLAB. If you don't find what you want there, then tell me a specific function and I might be able to find out more from my Mathworks constacts.
idris
idris on 7 Jul 2024 at 18:00 (Edited on 7 Jul 2024 at 18:00)
Dear Sir,
I was wondering if could share some materials to understanding image processing for Wireless access in vehicular environements.
Image Analyst
Image Analyst on 7 Jul 2024 at 18:16 (Edited on 7 Jul 2024 at 18:16)
I don't really know anything about image processing in vehicles - I've never had to deal with that situation. To understand MATLAB in general, try this: Best way(s) to master MATLAB? - MATLAB Answers - MATLAB Central
In addition, Steve Eddins, former image processing team leader at Mathworks, wrote a book about it, so you can look for that book.
cheng
cheng on 6 Jul 2024 at 7:31

Hello dear teacher, my name is Chris, I studied and recently qualified as a higher-level technician in industrial automation and control. I know that MATLAB is a widely used tool to carry out industrial automation and control processes. It is used to develop control algorithms, simulate control systems, design artificial intelligence algorithms for predictive maintenance, operations optimization, and generate real-time code for PLCs and industrial controllers. My question is, what do I have to learn so that the software can help me create matrices and vectors and be able to learn to use them in the field at an industrial level? I am also interested in learning Autodesk investor professional.

Thank you very much for your attention and information.

Greetings from a distance.

Image Analyst
Image Analyst on 7 Jul 2024 at 18:21
cheng
cheng on 7 Jul 2024 at 18:37

Muchas gracias por su orientación y apoyo.

Saludos.

Muhammad
Muhammad on 5 Jul 2024 at 18:01
Hello sir. Nice to hear your background. I need to ask you where should i start to master matlab? Looking forward to hear from you. Thank you.
Image Analyst
Image Analyst on 7 Jul 2024 at 18:17 (Edited on 7 Jul 2024 at 18:18)
@Muhammad See this link for a pretty comprehensive list of resources:
Zoumin
Zoumin on 4 Jul 2024 at 5:10
Hi, Mark ,I have an annoying promblem when I try to find the defections in the diff.bmp.
I tried to segment the defect by removing the contour artifacts with filtering methods and morphological manipulations, but it didn't work well, as shown in the myresult.bmp.
Is there any good way to accurately delineate the defects in the red box in the deftection.bmp?Or how to improve the effect of morphological manipulation?
Thanks for your generous contribution for the community.
Image Analyst
Image Analyst on 7 Jul 2024 at 18:23
I'd try normalized cross correlation. It's bascially like a template matching. See attached demo.
Baraa
Baraa on 3 Jul 2024 at 14:44
Hello
My name is Baraa and I am currently developing a code to measure the contact angle of different liquids.
I managed to finish the code in the question link below:
However, the code has to be manually edited every time the volume of the droplet changes, where I have to change the y-coordinate value in the generated mask to detect the edges of the droplet. How can I modify the code so that I don't have to manually define the x and y coordinates of the mask for each droplet?
Thanks in advance for your help.
Regards.
Image Analyst
Image Analyst on 3 Jul 2024 at 16:36
I've answered your post in Answers. I'm not sure how I missed it. But in the meantime, attached is my contact angle demo.
Jose
Jose on 3 Jul 2024 at 9:16
Hello,
I'm seeking assistance with an image processing task in MATLAB. I have an image, .jpg from SEM. I would like to quantify morphology and shapes of crystilized hydrated products.
Image Analyst
Image Analyst on 3 Jul 2024 at 11:46
@Jose, this looks like a question for Answers. Attach your image there and say exactly what kind of measurements you want, like intensity, area, area fraction, circularity, or whatever
Jose
Jose on 4 Jul 2024 at 1:10
Thank you for reply about my inquieries. Here are some details and the image.
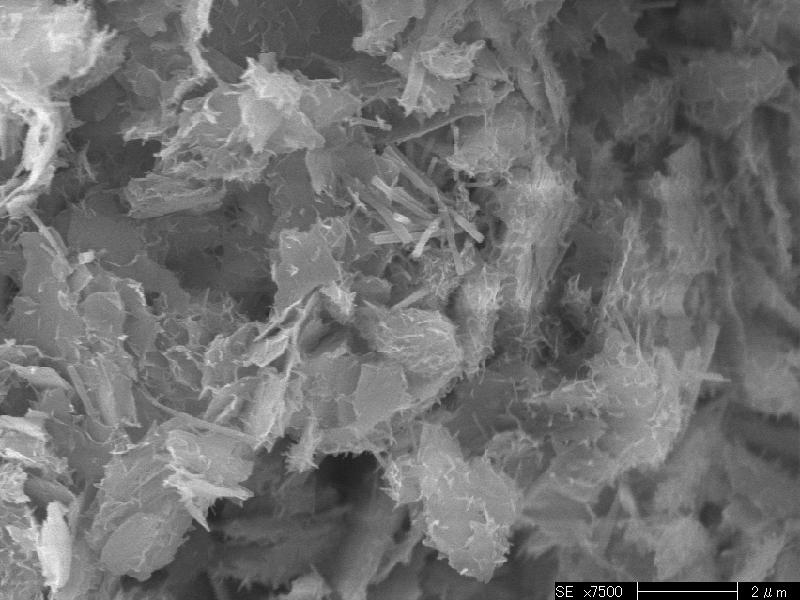
  1. Needle-like Shape (Ettringite, Ett): Identified by its needle-like, elongated crystal structure.
  2. Plate-like Crystalline Structure (Calcium Hydroxide, CH): Appears as plate-like shapes with more defined, flat surfaces.
  3. Fibrous Formation (Calcium Silicate Hydrate, CSH): Appears as fibrous or gel-like structures under a scanning electron microscope (SEM). These fibers can be loosely packed or densely interwoven, creating a complex network.
Image Analyst
Image Analyst on 4 Jul 2024 at 3:41
I still don't know what you want in terms of measurements. But the image looks extraordinarily difficult, at least for me, to say if a given pixel or small region belongs to one of those three classes you listed. I think this may be a case for deep learning but you'd have to manually identify, like by painting over the image, which pixels are from which class. Then do this for about a hundred images where each class will span the range from almost none of that class there, to the max that will ever be there. So you'll have 3 numbers (say based on area fraction or your human estimate of area fraction) for each image. Then you can build a model to predict the three numbers for any new image. Another possibility would be for you to just hand draw outlines or distances with the drawing tools and make measurements that way, so it's human assisted rather than fully automatic.
Jose
Jose on 4 Jul 2024 at 5:34
I really appreciate your feedback. I will try the human assisted rather than fully automatic.
Thank you
Nurul
Nurul on 3 Jul 2024 at 4:26
Hi Mark,
Thanks for your generous contribution for the community.
I'm seeking assistance with an image processing task in MATLAB. I have an image, F1.jpg, where I want to create a binary image (F2.jpg) that isolates the region below a blue line. Ideally, the pixels within the line should be white (1) and those outside the line, black (0). or vise-versa.
I've tried using the various thresholding techniques (included in the attached script, BinaryImage.m), but the resulting image (F1_BW.png) shows unwanted gray values in the black region. Thresholding doesn't seem to be fully removing these intermediate values.
My question is: How can I effectively extract the area within the blue line and convert it to a clean binary image (F1_BW.png) with only black and white pixels.
Image Analyst
Image Analyst on 4 Jul 2024 at 3:46
I'd just threshold, fill the region(s), then take the largest region (if you want just one and only one). I'm not sure what you're doing but I don't see any reason that an extremely smoothed boudary/outline would be any better or more accurate than the actual boundary you get from thresholding.
If you need more help, post in Answers and I, and others, can give you some code.
Nurul
Nurul on 5 Jul 2024 at 21:39
Thanks for your reply.
I'm actually dealing with a batch of 1920 RGB images. I'm trying to isolate the floodplain area, but thresholding picks up both the river and ocean since they appear similar in the images.
Anyone have suggestions for separating the floodplain (including the river) from the ocean in RGB images? I'm open to exploring other methods!
May I ask, by saying "ANSWERS", where do you want me to post this. I am new in asking questions in MATLAB forum.
Antonio
Antonio on 3 Jul 2024 at 2:05 (Edited on 3 Jul 2024 at 2:08)
I am having trouble figuring out how to use GUI modul;e in Matlab. I have downloaded a link to it provided by my Profeesor and it is just not working on my apple-mini desktop. Could you please assist with this matter?
Image Analyst
Image Analyst on 3 Jul 2024 at 2:31
@Antonio, possibly. But this sounds like a question for your professor (preferably) or the Answers forum. If your professor refuses to help you then you can upload the files needed to the Answers forum. If someone has all the toolboxes needed they may try to help you.
Luís Henrique Bordin
Luís Henrique Bordin on 2 Jul 2024 at 15:35
Dear Mark, I am Luis from NOAA. Could you help me please on a group scatter plot?
I have three regions (MSD, DPG and WFS) and four seasons (Winter, Spring, Summer and Autumn). I chose four colors to represent the seasons, and 3 symbols to represent the regions, however, the function doesn't understand this way. The symbols are correct to each region, but the colors are inconsistent, I think it is because there are 3 regions, but 4 seasons. The thing is, I need always the same color to the same season at each region/symbol, but I could not figure it out yet. Please, could you help me? The data is attached and the code below. Thank you very much in advance!
load gscat.m
gscatter(x,y,g,'rkgb','o*h',6,'on','Hind','Twin')
legend('Location','northeastoutside')
Image Analyst
Image Analyst on 2 Jul 2024 at 17:28
Luis, This is the kind of question that should be asked in the Answers forum.
Maria Merin Antony
Maria Merin Antony on 2 Jul 2024 at 4:40
I am Maria.
I need to use the radialdistribution function2D. this uses a histogram function which is not available now.
I am not able to find the URL.
Please help out to find the URL and code.
Image Analyst
Image Analyst on 2 Jul 2024 at 12:48
@Maria Merin Antony This looks like a question for the Berkeley professor who teaches the course, or the Chemistry Department there. Look at the calling code to see how it tries to call the histogram function and see if the built-in histogram takes the same arguments. If they're different call the UC Berkeley Chemistry department at (510) 642-5060 and ask how you can obtain the code.
hoang
hoang on 2 Jul 2024 at 2:03
Dear Mark,
please tell me, why is there a difference when graphing step function with PID control block in matlab and simulink
s =tf('s');
g = 1.883e5/(s*(s^2+4466*s+6.43e6));
kp = 60;
ki = 63000;
kd = 3;
gpid = pid(kp,ki,kd);
gsys = feedback(g*gpid,1);
step(gsys)
Image Analyst
Image Analyst on 2 Jul 2024 at 4:25
@hoang I have no idea. I have not used pid() and don't use Simulink. Try asking in the Answers forum.
HCH
HCH on 30 Jun 2024 at 13:45 (Edited on 30 Jun 2024 at 13:46)
Dear Mark,
I have some questions about interactive programming between Python and Matlab.
There are now some Matlab script files and executable files that can be run by entering relevant names and parameters in the Matlab command window. During the running process, some interactive operations are also required, such as selecting the working mode by displaying prompt words in the Matlab command window and entering 0 or 1 according to the actual working situation, opening a file option to select the desired file, displaying an image and clicking the mouse on it, and so on. Now I need to integrate these script files and executable files into a non Matlab application, and I plan to develop the application in Python language.
The first question is: Can the Matlab Engine API for Python implement interactive operations that can only be completed by Matlab Command Window in Python without modifying the original Matlab file? I tried the Matlab Engine API to connect Python and Matlab related files, but it seems that I cannot implement interactive operations in the Matlab command window. I am not sure if this language interface supports such interactive operations? Here https://ww2.mathworks.cn/help/matlab/matlab_external/user-input-not-supported.html Explained that when using C language to call Matlab, user input is not supported.
I don't know if Python language is also like this?
Second question: Is there a recommended way to implement the scenario mentioned above if the Matlab Engine API doesn't work?
Thank you, and also thank you for your contribution to the Mathworks community!
Image Analyst
Image Analyst on 30 Jun 2024 at 23:11
Sorry, though I took a week long course in Python, I didn't see anything there that I couldn't do natively in MATLAB so I never wrote Python code and then used MATLAB to run the Python code. Maybe try asking in Answers, or see if you can do it all in Python, in which case you might have to ask in a Python-only forum for how to get user input.
saleel
saleel on 30 Jun 2024 at 13:00
why is (MiniBatch) don't work now in matlab 2023b?
Image Analyst
Image Analyst on 30 Jun 2024 at 23:07
No idea. I was not aware you could not do minibatches in that version. It's probably an error in your code. If not, call tech support or try posting in Answers.
Tatyana
Tatyana on 28 Jun 2024 at 7:21
Dear Mark, thanks for doing this AMA.
I'm a newbie asking for your advice - Is it possible to solve the following problem using MATLAB?
I have a CT study (CBCT) of the mandible. I want to highlight areas of the jaw (3D rendering image) with different densities in different colors based on Hounsfield units (f.e. area with HU>1250 -green, 850<HU<1250 - blue, 350<HU<850 -red, etc)
Is it possible- to use Hounsfield Units in Matlab?
Image Analyst
Image Analyst on 28 Jun 2024 at 15:48
@Tatyana yes it is. You can do it in several ways, like making a solid RGB image, or showing the regions "tinted" as an semi-transparent overlay above the original image.
greenMask = huImage > 1250;
blueMask = huImage > 850 & huImage <1250
etc.
I haven't done a lot with pseudocoloring 3-D images. It's trickier than 2-D images, which is easy. There is a volume viewer app in MATLAB that might help. I know our CT people usually use AVIZO software for their 3-D visualization tasks.
This is a good question to post in Answers after you read this: TUTORIAL: How to ask a question (on Answers) and get a fast answer Be sure to attach your image so people can offer actual code solutions.

See Also

Tags